
Data interpretation is a crucial aspect of competitive exams like the OSSC CGL (Odisha Staff Selection Commission Combined Graduate Level). To excel in this section, candidates need to have a strong grasp of mathematical concepts and the ability to interpret data accurately. Here, we present a curated list of 30 multiple-choice questions (MCQs) on data interpretation to help you sharpen your skills for the OSSC CGL exam.
Top 30 Data Interpretation MCQs for OSSC CGL
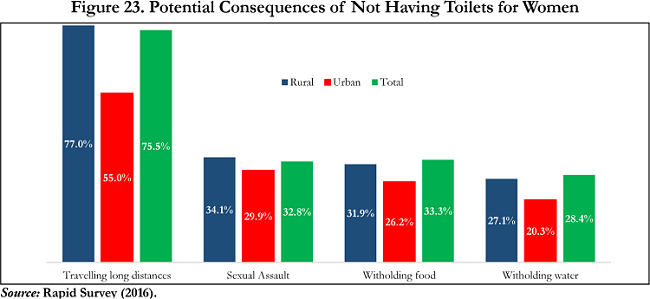
1. Percentage of urban women facing the problem of travelling long distances is what percentage less than the percentage of rural women who face the same problem?
(a) 9.09%
(b) 11.11%
(c) 14.28%
(d) 28.57%
(e) none of these
Ans. 1. (d)
Percentage of rural women facing the problem of travelling long distances= 77
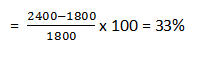
Therefore, required percentage=

(a) 29:13
(b) 13:29
(c) 27:12
(d) 12:27
(e) none of these
Ans. 2. (b)

Therefore required ration=

3. If the total number of women are 2,50,000 with 32,400 women other than rural and urban women who are facing the withholding water problem, and the ratio of rural women to urban women facing the same problem is 9:7, then the difference between rural women and urban women facing the problem of withholding water is:
(a) 1500
(b) 2820
(c) 4825
(d) 4500
(e) none of these
Ans. 3. (c)
= 71000
Therefore rural & urban women facing the same problem= 71000-32400=38600

4. If there are 62,500 rural women, then the difference between rural women facing the problem of ‘sexual assault’ and ‘withholding food’ is:
(a) 1250
(b) 1375
(c) 1490
(d) 1610
(e) none of these
Ans. 4. (b)
=62500×2.2%
=625×2.2=1375
5. If there are 50,000 rural women & 45,000 urban women, then the difference between rural women facing the problem of travelling long distances and rural women facing the problem of sexual assault is approximately what percent of the number of urban women facing the problem of sexual assault?
(a) 150%
(b) 160%
(c) 165%
(d) 170%
(e) none of these
Ans. 5. (b)

⇒160% approx.
(6-10): The information below provides insights into the population distribution across six different villages (A, B, C, D, E, and F). The bar chart illustrates the number of people in each village, while the table outlines the literacy ratios and the percentage of males residing in these villages.
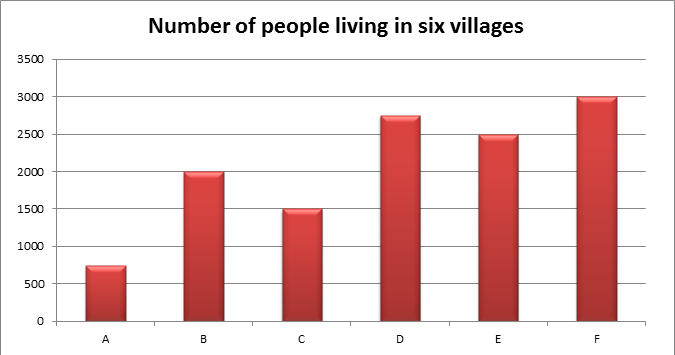
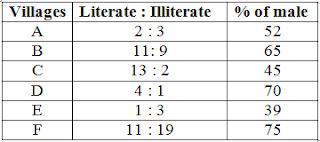
6. If 40% of the female from village B is literate, then what is the percentage of male, who is illiterate from village B?
A. 38%
B. 35%
C. 37%
D. Cannot be determined
E. None of these
Ans: Option C
→ No. of illiterate female from village B = 60 % (700) = 420
→ No. of illiterate from village B= (9/20)* 2000 = 900
Therefore,
→ No. of illiterate male from village B= 900- 420 =480
→ No. of male from village B = 65 %( 2000) = 1300
→ % of male, who is illiterate from village B = (480/1300) * 100 = 36.9 ≈ 37 (ans)
7. What is the percentage of literate people in all the six villages together?
A. 55%
B. 53%
C. 51%
D. Cannot be determined
E. None of these
Ans: Option B
→ No. of Literate from village A = (2/5)*750 = 300
→ No. of Literate from village B = (11/20)*2000 = 1100
→ No. of Literate from village C = (13/15)*1500 = 1300
→ No. of Literate from village D = (4/5)*2750 = 2200
→ No. of Literate from village E = (1/4)*2500 = 625
→ No. of Literate from village F = (11/30)*3000 = 1100
→ Total no. of literate in all villages= 300+1100+1300+2200+625+1100 = 6,625
→ Total no. of people in all villages= 750+2000+1500+2750+2500+1100 =12,500
→ % of literate people in all villages = (6,625/12,500)* 100 = 53 % (ans)
8. What is the ratio between the number of illiterate people from villages B, C & D to the number of females from villages A, E & F?
A. 320:527
B. 527:330
C. 330:527
D. 527:320
E. None of these
Ans: Option C
→ Illiterate from village B= 2000-1100 =900
→ Illiterate from village C=1500-1300 =200
→ Illiterate from village D= 2750-2200 =550
→ Female from village A= 48% (750) = 360
→ Female from village E= 61% (2500) = 1525
→ Female from village F= 25% (3000) = 750
→ Ratio = (900+200+550) : (360 + 1525+750) = 1650 : 2635 = 330 : 527 (ans)
9. If 3% of females from village D and 5% of females from village E are literate, then what is the total number of literate males from D & F together?
A. 1823
B. 1723
C. 1623
D. Cannot be determined
E. None of these
Ans: Option D
→ Since we don’t have enough data for village F
→ We cannot determine the answer
10. The number of females from villages A & C is how much percentage more or less than the number of females from villages D & F?
A. 24.76%
B. 24.72%
C. 25.76%
D. 25.72%
E. None of these
Ans: Option A
→ Female from village A= 360
→ Female from village C = 825
→ Total = 1185
→ Female from village D= 825
→ Female from village F= 750
→ Total= 1575
→ Less% = [(1575 – 1185) /1575] * 100 = (390/1575)* 100 = 24.76 % (ans)
(11- 15):
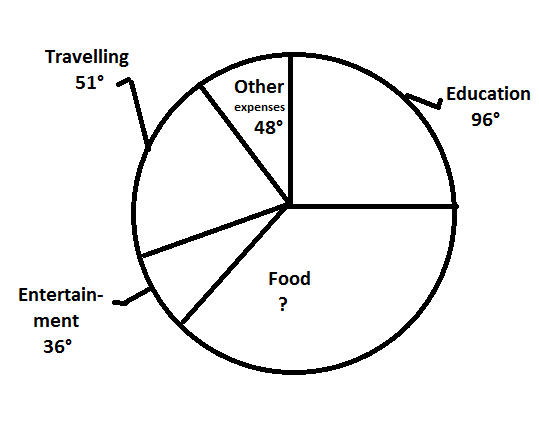
The following table shows the further distribution (in percent) of the above-mentioned items among the five family members i.e P (the person himself), W (his wife), Rahul (son), Rohit (son), and Preeti (his daughter). His monthly family budget is Rs. 1,20,000
| Education | Food | Entertainment | Travelling | Other expenses | |
|---|---|---|---|---|---|
|
P
|
10
|
30
|
10
|
40
|
20
|
|
W
|
15
|
25
|
30
|
10
|
25
|
|
Rahul
|
40
|
20
|
20
|
25
|
20
|
|
Rohit
|
25
|
15
|
25
|
10
|
10
|
|
Preeti
|
10
|
10
|
15
|
15
|
25
|
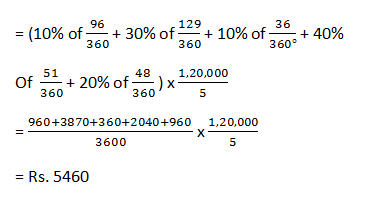
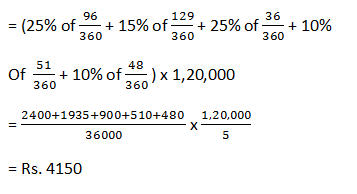
11. What is the average expense of P?
- Rs. 5620
- Other than the given options
- Rs. 5640
- Rs. 5460
- Rs. 5480
Ans: 4
Average expenses of P
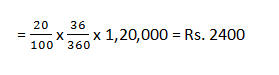
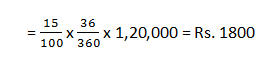
12. What is the approximate percentage increase in the amount which Rahul enjoys for entertainment as compared to Preeti for the same?
- 33%
- 31%
- Other than the given options
- 37%
- 35%
Ans: 1
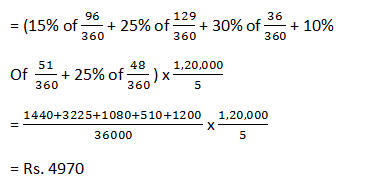
13. The average expenses of Rohit is approximately what percent of the average expenses of W (Wife)?
- 76.4%
- 81.5%
- 79.5%
- 83.5%
- Other than the given options
Ans: 4
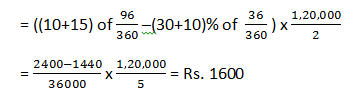
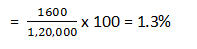
14. Find the difference (in percentage of the budget) between the average expenses on Education and the average expenses on Entertainment of the couple?
- 1.3%
- 0.9%
- 2%
- Other than the given options
- 2.5%
Ans: 1
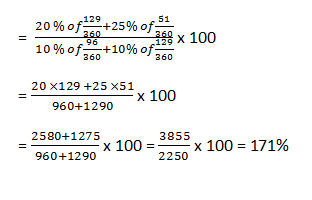
15. The total amount spent by Rahul on Travelling and Food is approximately what percent of the total amount spent by Preeti on Education and Food?
- Other than the given options
- 168%
- 171%
- 175%
- 174%
Ans: 3
(16-20): Study the given table carefully to answer the following questions.
| Field Name | Shape | Side (in m) | Base (in m) | Height (in m) | Radius (in m) | Cost of flooring (in Rs. per sq. metre) | Cost of fencing (in Rs. per m) |
|---|---|---|---|---|---|---|---|
| A | Triangle | 16 | 12 | 50 | 20 | ||
| B | Rectangle | 10 × 20 | 30 | 15 | |||
| C | Square | 15 | 40 | 18 | |||
| D | Parallelogram | 20 | 12 | 60 | 25 | ||
| E | Circle | 10 | 45 | 22 |
Q16. What is the cost of flooring of A?
a) Rs.4000
b) Rs.4600
c) Rs.4800
d) Rs.5000
e) Rs.4400
Ans:
So, area of A = 1/2 × 16 × 12 = 96 m2
So, cost of flooring of A = 96 × 50 = Rs.4800
Q17. What is the difference between the cost of fencing of C and that of B?
a) Rs.180
b) Rs.120
c) Rs.240
d) Rs.360
e) Rs.480
Ans:
So, cost of fencing of B = 60 × 15 = 900
Perimeter of C = 4 × 15 = 60 m
So, cost of fencing of C = 60 × 18 = Rs.1080
So, required difference = 1080 – 900 = Rs.180
Q18. What is the ratio of the cost of flooring to that of fencing of field D?
a) 4 : 1
b) 6 : 1
c) 8 : 1
d) 9 : 1
e) 5 : 1
Ans: Option D
Area of D = Base × Height
= 20 × 12 = 240m2
So, cost of flooring of D= 240 × 60 = Rs.14400
Perimeter of D = 2 (20 + 12) = 64 m
So, cost of fencing of D = 64 × 25 = Rs.1600
So, required ratio = 14400 : 1600 = 9 : 1
Q19. The cost of fencing of field E is approximately what percent of the cost of flooring of field C?
a) 10.5%
b) 19.46%
c) 18.71%
d) 15.36%
e) 13.82%
Ans: Option D
Perimeter of E = 2πr = 2 × 22 / 7 × 10 = 440 / 7 m
Cost of fencing of E = 440 / 7 × 22 = Rs.1382.85
Area of C = (15)2= 225m2
So, cost of flooring of C = 225 × 40 = Rs.9000
So, required % = 1382.85 × 100 / 9000
= 15.36% of flooring cost of C.
Q20. The cost of fencing of field C is what percent of the cost of fencing of field D?
a) 87.54%
b) 67.5%
c) 72.13%
d) 54.36%
e) 46.5%
Ans: Option B
Fencing cost of C = Rs.1080
Fencing cost of D = Rs.1600
Required % = 1080 / 1600 × 100 = 67.5%
(21-25): Study the following information carefully and answer the questions given below:
In a college there are 1400 students who are doing graduation in any one of the subjects, out of the five different subjects viz. zoology,
Botany, Mathematics, Physics and Statistics. The ratio of the number of boys and girls among them is 6:8.30% of the total girls are doing graduation in Zoology and 20% of the total girls are doing graduation in Statistics. The total number of students doing graduation in Botany is 220. 250 students are doing graduation in Mathematics. The ratio of the number of girls and the number of boys doing graduation in Statistics is 2:1.20% of the total number of boys are doing graduation in Botany. The ratio of the number of girls and that of boys doing graduation in Mathematics is 2:3. There are an equal number of boys and girls doing graduation in Physics. 290 students are doing graduation in Zoology.
Answer
Number of girls = 800
|
Girls
|
Boys
|
|
|
Zoology
|
30 x 8 = 240
|
290 – 240 = 50
|
|
Botany
|
220 – 120 = 100
|
20 x 6 = 120
|
|
Mathematics
|
2/5 x 250 = 100
|
3/5 x 350 = 150
|
|
Physics
|
200
|
200
|
|
Statistics
|
20 x 8 = 160
|
160/2 = 80
|
21. What is the total number of students doing graduation in physics and Statistics together?
A. 510
B. 540
C. 640
D. 620
E. 660
Ans: 3
Required answer = 200 + 200 + 160 + 80 = 640
22. What is the ratio of the number of boys doing graduation in Mathematics to the number of girls doing graduation in Botany?
A. 1:2
B. 3:1
C. 3:4
D. 3:2
E. 2:1
Ans: 4
Required ratio = 150 : 100 = 3:2
23. What is the difference between the number of boys doing graduations in Zoology and the number of girls doing graduation in Mathematics?
A. 50
B. 75
C. 60
D. 45
E. 55
Ans: 1
Required difference = 100 – 50 = 50
24. In which of the following graduation courses, the number of girls is the highest, and in which course is the number of boys the second lowest respectively?
A. Statistics and Zoology
B. Zoology and Botany
C. Physics and Statistics
D. Zoology and Statistics
E. Physics and Zoology
Ans: 4
Zoology and statistics
25. The number of girls doing graduation in Statistics is what percent of the number of boys doing graduation in physics?
A. 76%
B. 75%
C. 80%
D. 81%
E. 78%
Ans: 3
Required percentage = 160/200 x 100 = 80%
(26-30): Read the following table carefully and answer the questions given below it. Data related to number of students who got admission and who left the given five colleges 1,2,3,4 and 5 during the given years.
COLLEGE 1 COLLEGE 2 COLLEGE 3 COLLEGE 4 COLLEGE 5
| YEARS | ADM | LEFT | ADM | LEFT | ADM | LEFT | ADM | LEFT | ADM | LEFT |
| 2008 | 161 | – | 148 | – | 179 | – | 116 | – | 128 | – |
| 2009 | 148 | 58 | 172 | 60 | 161 | 90 | 208 | 60 | 191 | 50 |
| 2010 | 135 | 69 | 188 | 96 | 143 | 101 | 169 | 45 | 167 | 79 |
| 2011 | 112 | 88 | 173 | 59 | 165 | 58 | 142 | 56 | 185 | 82 |
| 2012 | 141 | 39 | 151 | 48 | 179 | 66 | 155 | 108 | 142 | 91 |
26. What is the average number of students who got admission in College 4 during all the given years taken together?
(a) 156
(b) 164
(c) 166
(d) 158
Ans: (d) 158
27. If the respective ratio of the number of boys and girls in College 2 at the end of 2010 was 5:6, what was the number of girls in College 2 at the end of 2010?
(a) 212
(b) 186
(c) 208
(d) 192
Ans: (d) 192
28 In which of the given colleges were the number of students highest at the end of 2009?
(a) 1
(b) 2
(c) 3
(d) 5
Ans: (d) 5
29. What was the total number of students in College 1 at the end of 2011?
(a) 335
(b) 347
(c) 329
(d) 341
Ans: (d) 341
(116 + 148 + 135 + 112 ) – (58 + 69 + 88 ) = 341
30. What is the respective ratio between the total number of students who joined College 3 in 2010 and 2011 together and the total number of students who left College 5 in 2010, 2011, and 2012 together?
(a) 22:17
(b) 11:9
(c) 13:9
(d) 11:7
Ans: (b) 11:9