

Data interpretation is a crucial aspect of competitive exams like the OSSC CGL (Odisha Staff Selection Commission Combined Graduate Level). To excel in this section, candidates need to have a strong grasp of mathematical concepts and the ability to interpret data accurately. Here, we present a curated list of 30 multiple-choice questions (MCQs) on data interpretation to help you sharpen your skills for the OSSC CGL exam.
Top 30 Data Interpretation MCQs for OSSC CGL
- Question: In a survey of 200 people, 60% liked apples, 40% liked bananas, and 30% liked both apples and bananas. How many people liked neither apples nor bananas?
- A) 20
B) 40
C) 60
D) 80Answer: C) 60Solution: Total people who liked either apples or bananas = 60% + 40% – 30% = 70% Number of people who liked neither = 100% – 70% = 30% Number of people who liked neither = 30% of 200 = 60. - Question: A company sells two types of products: Product A and Product B. In a certain month, the company sold 500 units of Product A and 800 units of Product B. If the revenue from Product A was $5000 and the revenue from Product B was $7200, what is the average selling price per unit of Product A?A) $10
B) $15
C) $20
D) $25Answer: A) $10Solution: Average selling price per unit of Product A = Total revenue from Product A / Number of units of Product A sold Average selling price per unit of Product A = $5000 / 500 units = $10. - Question(3-8): The following table shows the number of students enrolled in different courses in a university. What is the total number of students enrolled in courses other than Engineering and Medicine?
Course Number of Students Engineering 500 Medicine 300 Arts 400 Commerce 250 Science 350 A) 700
B) 1000
C) 900
D) 1050Answer: B) 1000
Solution: Total number of students enrolled in courses other than Engineering and Medicine = Total number of students – (Number of students in Engineering + Number of students in Medicine) Total number of students enrolled in courses other than Engineering and Medicine = 400 + 250 + 350 = 1000
- The table shows the number of students enrolled in different courses in a university. What percentage of students are enrolled in Commerce?
A) 10%
B) 14%
C) 20%
D) 25%
Answer: B) 14%
Solution:
Total number of students enrolled in Commerce = 250
Total number of students = 500 + 300 + 400 + 250 + 350 = 1800
Percentage of students enrolled in Commerce = (250 / 1800) * 100 = 13.89% ≈ 14% - Question:What is the difference between the number of students enrolled in Science and the number of students enrolled in Arts?
A) 50
B) 100
C) 150
D) 200
Answer: A) 50
Solution:
Number of students enrolled in Science = 350
Number of students enrolled in Arts = 400
Difference = 400 – 350 = 50 - Question:If 20% of the students enrolled in Engineering are female, how many female students are enrolled in Engineering?A) 100
B) 150
C) 200
D) 250
Answer: A) 100
Solution:Number of students enrolled in Engineering = 500
Percentage of female students = 20%
Number of female students = (20/100) * 500 = 100 - Question: What percentage of the total number of students are enrolled in Engineering and Medicine together?
A) 35%
B) 40%
C) 45%
D) 50%
Answer: C) 45%
Solution:
Total number of students enrolled in Engineering and Medicine = 500 + 300 = 800
Total number of students = 1800
Percentage of students enrolled in Engineering and Medicine = (800 / 1800) * 100 = 44.44% ≈ 45% - Question: If the university wants to increase the number of students enrolled in Science by 20%, how many additional students need to be enrolled?
A) 50
B) 70
C) 80
D) 100
Answer: C) 80
Solution: Current number of students enrolled in Science = 350
Additional 20% of 350 = 0.20 * 350 = 70
Additional students needed = 70Q(9-13)The table below shows the monthly sales data of a company for four products (A, B, C, D) over a year.Month Product A Product B Product C Product D January 1000 800 1200 600 February 1200 750 1100 700 March 1100 850 1000 800 April 900 900 1050 750 May 950 1000 950 800 June 1050 850 1000 900 July 1100 800 1100 950 August 1150 750 1050 1000 September 1200 700 1000 1100 October 1250 650 950 1150 November 1300 600 900 1200 December 1350 550 850 1250 - Question: What was the total sales of Product A in March and April ?
A) 9900
B) 9350
C) 2000
D) 8250
Answer: C) 2000
Solution:
Total sales of Product A in March and April = 1100+ 900=2000 - Question: Which product had the highest sales in July?
A) Product A
B) Product B
C) Product C
D) Both A and C
Answer: C) Both A and C
Solution:
Product A & C had the highest sales in July = 1100 - Question: What was the average sales of Product D over the 12 months?
A) 875
B) 900
C) 775
D) 725
Answer: B) 933
Solution:
Average sales of Product D = (600 + 700 + 800 + 750 + 800 + 900 + 950 + 1000 + 1100 + 1150 + 1200 + 1250) / 12 = 933 - Question: In which month did Product A have the lowest sales?
A) November
B) December
C) January
D) April
Answer: D ) April
Solution:
Product A had the lowest sales in April= 900
Question: What was the total sales of all products in October?
A) 5000
B) 3000
C) 3200
D) 5300
Answer: B) 3000
Solution:
Total sales of all products in October = 1250 + 650 + 950 + 1150 = 3000
(Q 14-18)The table below shows the monthly income and expenditure of a person.
| Month | Income ($) | Expenditure ($) |
|---|---|---|
| January | 3000 | 2500 |
| February | 3200 | 2800 |
| March | 3500 | 3000 |
| April | 3300 | 2700 |
| May | 3100 | 2600 |
| June | 3400 | 2900 |
| July | 3600 | 3100 |
| August | 3800 | 3200 |
| September | 3700 | 3100 |
| October | 4000 | 3300 |
| November | 4200 | 3500 |
| December | 4300 | 3600 |
14. Question: What was the total Savings in June?
A) $500
B) $600
C) $800
D) $400
Answer: A) $500
Solution: Total savings earned in June = $3400-2900=500
15. Question: In which month was the expenditure the highest?
A) November
B) December
C) October
D) September
Answer: B) December
Solution: Expenditure was highest in September = $3600
16. Question: What was the total savings in April?
A) $500
B) $600
C) $700
D) $800
Answer: B) $600
Solution: Total savings in April = Income – Expenditure = $3300 – $2700 = $600
17. Question: In which month was the income 10% more than the expenditure?
A) May
B) June
C) July
D) August
Answer: C) July
Solution: Income in July = $3600, Expenditure in July = $3100 10% of Expenditure in July = 0.10 * $3100 = $310 Income more than Expenditure = $3600 – $3100 = $500
18. Question: What was the average income over the 12 months?
A) $3600
B) $3700
C) $3800
D) $3900
Answer: A) $3600
Solution: Average income = (3000 + 3200 + 3500 + 3300 + 3100 + 3400 + 3600 + 3800 + 3700 + 4000 + 4200 + 4300) / 12 = $3591.6
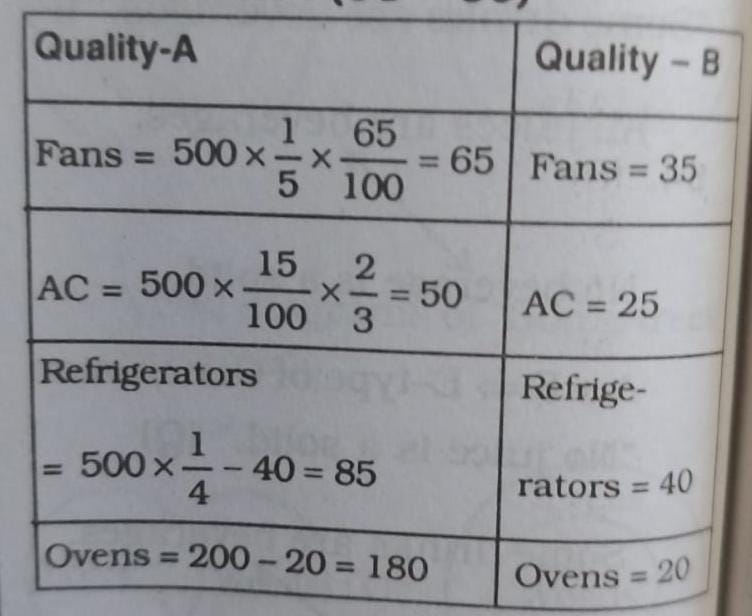
Directions (19-24): Study the following information carefully to answer the questions that follow :A company produces 4 differ- ent products viz., AC, Fans, Refrig- erators and Ovens each product of two different qualities i.e., Quality A and Quality B. The company pro- duces a total of 500 products. One- fifth of total number of products are fans out of which 35% are of Qual- ity B. Fifteen percent of the total number of products are AC. Two- thirds of AC’s are of Quality A. Twenty five percent of the total number of products are refrigera- tors out of which 40 are of Quality B. Ten percent of the number of ovens are of Quality -B.
19. What is the total number of AC’s and ovens of Quality-B and fans and refrigerators of Quality-A together made by the company?
(A) 165
(B) 205
(C) 155
(D) 195
Answer(D) 195
Sol: Required answer = 25 + 20 + 65 + 85 = 195
20. What is the average number of products of Quality-A made by the company?
(A) 90
(B) 75
(C) 80
(D) 95
Answer: (D) 95
Sol: Average number of product of quality – A
= (65 + 50 + 85 + 180)/4 = 380/4 = 95
21. What is the respective ratio between the number of ovens of Quality-B and the number of fans of Quality-A?
(A) 5:2
(B) 4:13
(C) 5:13
(D) 4:9
Answer: (B) 4:13
Sol: Required ratio = 20/65 = 4/13
22. What is the difference be- tween the number of AC’s of Quality A and Quality B?
(A) 25
(B) 50
(C) 35
(D) 40
Answer: (A) 25
Sol:(A) Required difference = 50-25 = 25
23. Number of refrigerators of Quality-A is approximately what percent of the total num- ber of ovens (both Quality-A and B together)?
(A) 39
(B) 31
(C) 35
(D) 43
Answer: (D) 43
Sol: (D) Required percentage = 85/200 * 100 = 43
24-28: Study the graph below and answer the questions 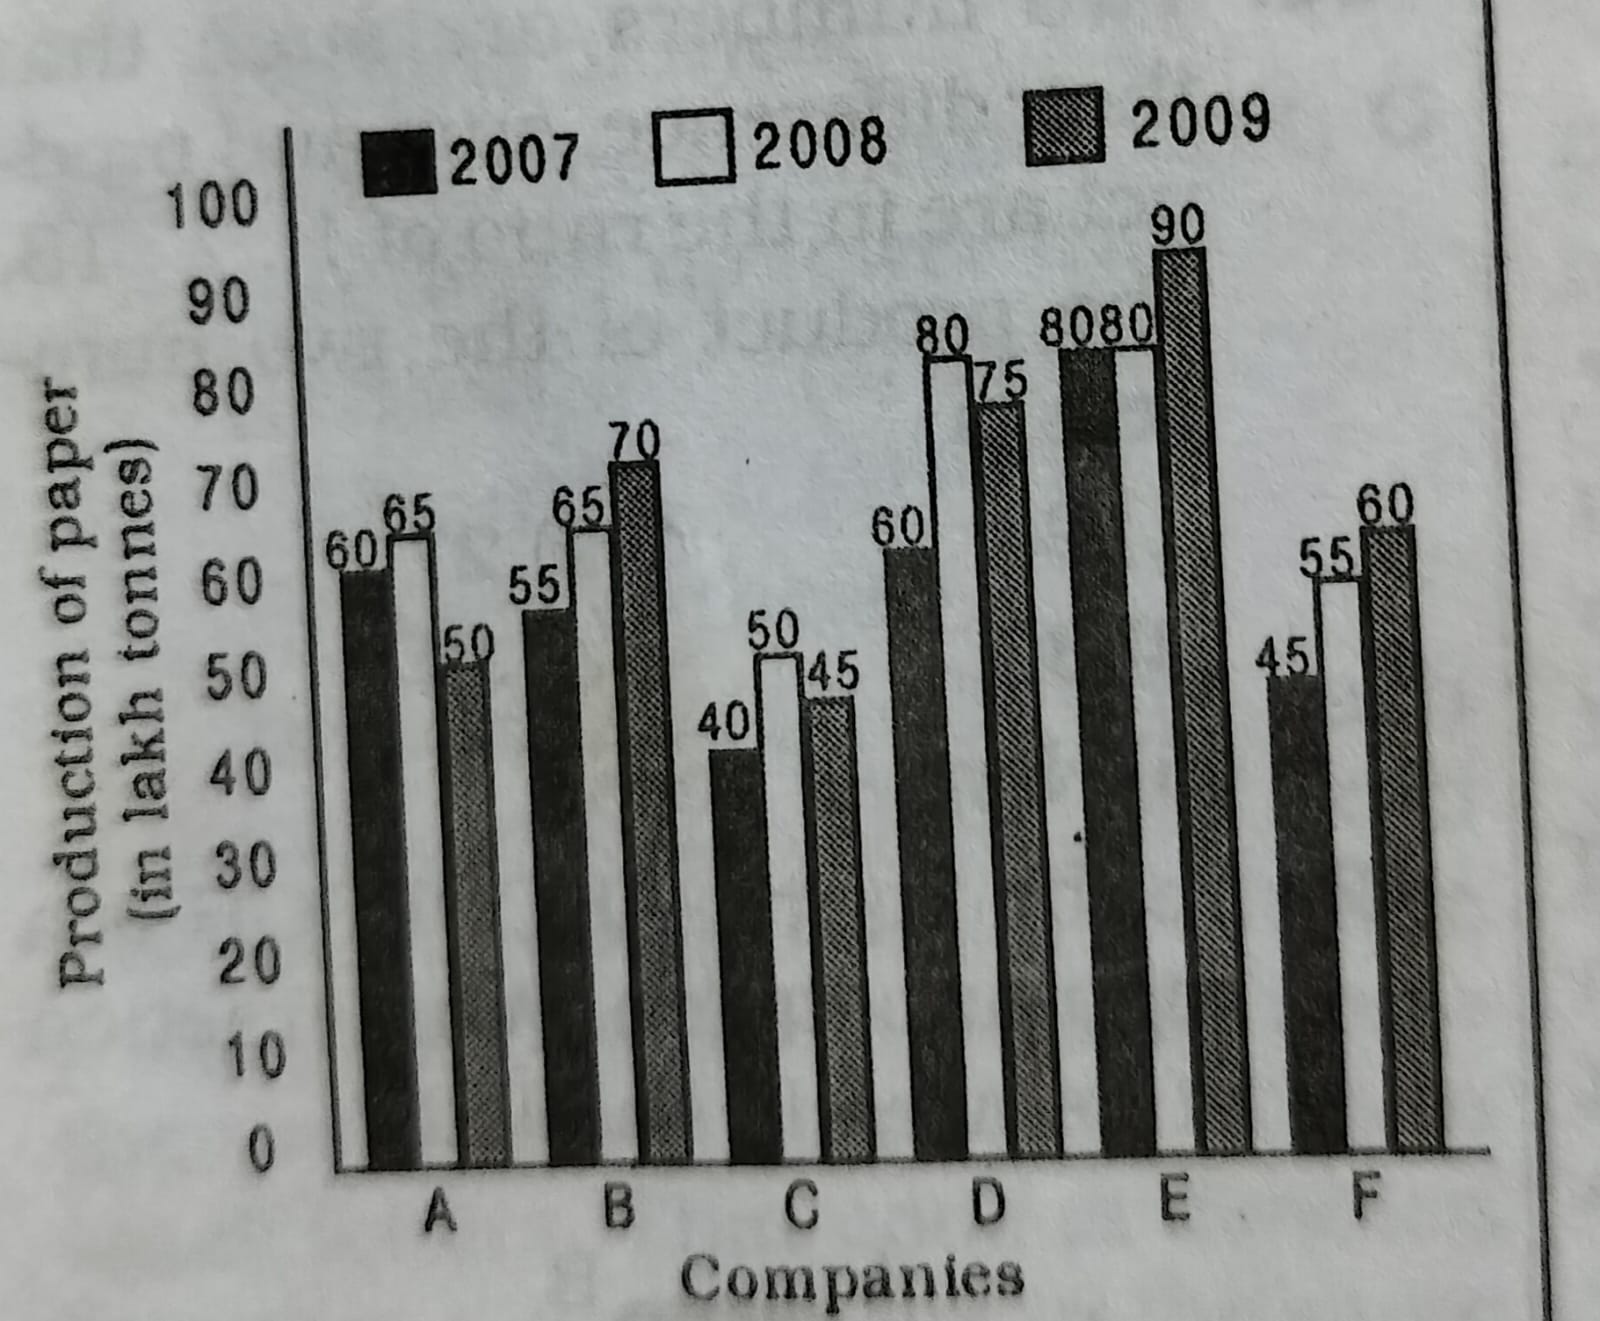
24.What is the difference between average production (in lakh ✓ tonnes) of paper of the six com- panies in 2008 and average production of the same com- panies in 2007?
(1) 8.33
(2) 8.73
(3) 9.17
(4) 7.86
Answer:(3) 9.17
Sol: Required difference in lakh tonnes = 9.17 lakh tonnes
25. The percentage increase in pro- duction by company B from 2008 to 2009 is approximate- ly.
(1) 7.7
(2) 8.3
(3) 9
(4) 18.2
Answer:(1) 7.7
Sol:Required percentage increase = (70 – 65)/65 * 100 =approx 7.7
26. Which of the four companies A, B, C, and F has recorded the maximum percentage growth from 2007 to 2008?
(1) A
(2) B
(3) C
(4) E
Answer:(3) C
Sol: It is obvious from the graph.
27. Production of company C in 2008 and production of com- pany F in 2007 together is what percent of production of com- pany D in 2009?
(1) 106.73
(2) 126.67
(3) 142.76
(4) 146.67
Answer:(2) 126.67
Sol: Required percentage = (50 + 45)/75 * 100 = 95/75 * 100 =approx 126.67
28-30: The table below shows the number of bikes sold by three friends (A, B, and C) over a period of 6 months.
| Month | Friend A | Friend B | Friend C |
|---|---|---|---|
| January | 15 | 20 | 10 |
| February | 20 | 25 | 15 |
| March | 25 | 30 | 20 |
| April | 30 | 35 | 25 |
| May | 35 | 40 | 30 |
| June | 40 | 45 | 35 |
28. Question: What was the total number of bikes sold by Friend A in March and April?
A) 50
B) 55
C) 60
D) 65
Answer: B) 55
Solution: Total number of bikes sold by Friend A in March = 25 Total number of bikes sold by Friend A in April = 30 Total = 25 + 30 = 55
29. Question: Which friend sold the least number of bikes in May?
A) Friend A
B) Friend B
C) Friend C
D) None of the above
Answer: C) Friend C
Solution: Friend C sold the least number of bikes in May = 30
30. Question: What was the total number of bikes sold by Friend B in February, March, and April?
A) 70
B) 75
C) 90
D) 85
Answer: C) 90
Solution: Total number of bikes sold by Friend B in February = 25 Total number of bikes sold by Friend B in March = 30 Total number of bikes sold by Friend B in April = 35 Total = 25 + 30 + 35 = 90