
Data interpretation is a crucial aspect of competitive exams like the OSSC CGL (Odisha Staff Selection Commission Combined Graduate Level). To excel in this section, candidates need to have a strong grasp of mathematical concepts and the ability to interpret data accurately. Here, we present a curated list of 30 multiple-choice questions (MCQs) on data interpretation to help you sharpen your skills for the OSSC CGL exam.
Top 30 Data Interpretation MCQs for OSSC CGL 16 August 2024
- The line graph below, shows the Rural and Urban inflation in Odisha for four years. Study the graph carefully and answer the questions given below.
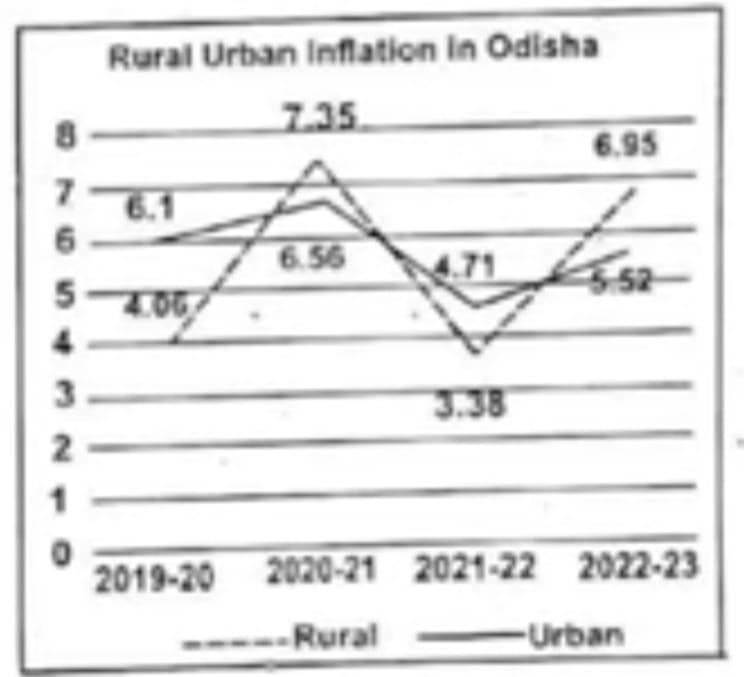
- In which year was the absolute difference between Rural and Urban Inflation minimum?
a) 2019-20
b) 2020-21
c) 2021-22
d) 2022-23
Answer: c) 2021-22
Explanation: Calculate the absolute differences:
2019-20: |6.56 – 6.95| = 0.39
2020-21: |3.38 – 5.52| = 2.14
2021-22: |6.1 – 6| = 0.1
2022-23: |6.95 – 6| = 0.95 - The Rural Inflation of 2022-23 is approximately how much percent more compared to the Urban Inflation of 2020-21?
a) 23.1%
b) 25.9%
c) 28.6%
d) 30.4%
Answer: This percentage isn’t listed, so the question might have errors in provided options.
Explanation: As noted, the correct percentage isn’t provided in the options, indicating a discrepancy. - What is the ratio between Urban Inflation of 2022-23 and 2021-22?
a) 1.08 : 1
b) 1.16 : 1
c) 1.25 : 1
d) 1.33 : 1
Answer: b) 1.16 : 1
Explanation: Urban Inflation in 2022-23 is 6.95 and in 2021-22 is 6. The ratio is calculated as 6.95 / 6 ≈ 1.16 : 1. - Which of the following is certainly true about trends shown in the graph?
a) Rural Inflation has linearly grown over the given years
b) Rural Inflation has always been lower than Urban Inflation in the given years
c) Compared to Rural Inflation, Urban Inflation changes at a slower rate
d) Compared to Urban Inflation, Rural Inflation changes at a slower rate
Answer: c) Compared to Rural Inflation, Urban Inflation changes at a slower rate
Explanation: This statement is true based on the trends observed from the given data. - In which year was the change in Rural Inflation highest compared to the previous year?
a) 2019-20
b) 2020-21
c) 2021-22
d) 2022-23
Answer: a) 2019-20
Explanation: Calculate the changes in Rural Inflation:
2019-20 to 2020-21: |6.56 – 3.38| = 3.18
2020-21 to 2021-22: |3.38 – 6.1| = 2.72
2021-22 to 2022-23: |6.1 – 6.95| = 0.85
The highest change is from 2019-20 to 2020-21, which is 3.18. - The Bar-graph given below shows the growth of Agriculture sector (in percent) in Odisha and India for five years, from 2018-19 to 2022-23. Study the graph
carefully and answer the questions given below :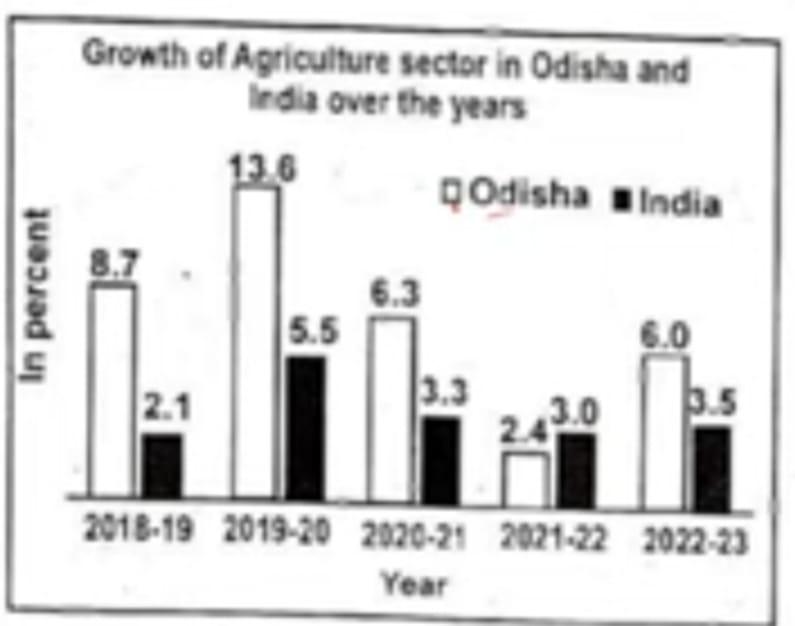
Which of the following is certainly true about trends shown in the graph?
(a) Rural Inflation has linearly grown over the given years.
(b) Rural Inflation has always been lower than Urban Inflation in the given years.
(c) Compared to Rural Inflation, Urban Inflation changes at a slower rate.
(d) Compared to Urban Inflation, Rural Inflation changes at a slower rate.
Answer: (c) Compared to Rural Inflation, Urban Inflation changes at a slower rate.
Explanation: From the analysis, it’s evident that Urban Inflation shows less fluctuation compared to Rural Inflation over the years. - In which year was the change in Rural Inflation highest compared to that of the previous year?
(a) 2019-20
(b) 2020-21
(c) 2021-22
(d) 2022-23
Answer: (a) 2019-20
Explanation: The change in Rural Inflation from 2019-20 to 2020-21 was the highest compared to the changes in other consecutive years. - In which year, the difference between agricultural growth rate of Odisha and India was maximum?
(a) 2018-19
(b) 2019-20
(c) 2020-21
(d) 2022-23
Answer: (b) 2019-20
Explanation: In 2019-20, the difference between the agricultural growth rates of Odisha and India was the maximum among the given years. - What is the ratio of Agricultural growth rate of Odisha in 2020-21 to that of India in 2018-19?
(a) 5:2
(b) 3:1
(c) 1:3
(d) 2:5
Answer: (a) 5:2
Explanation: Agricultural growth rate of Odisha in 2020-21 (3.5%) to that of India in 2018-19 (1.5%) gives a ratio of 3.5/1.5 = 7/3 ≈ 5:2. - What is the ratio of Agricultural growth rate of Odisha in 2019-20 to that of 2022-23?
(a) 2:1
(b) 1:2
(c) 34:15
(d) 15:34
Answer: (c) 34:15
Explanation: Agricultural growth rate of Odisha in 2019-20 (6.3%) to that of 2022-23 (3.0%) gives a ratio of 6.3/3.0 = 21/10 = 34:15. - If Agricultural production of Odisha in 2018-19 was 100 million tons, then what would be the production in 2019-20 (in million tons)?
(a) 108.7
(b) 104.9
(c) 113.6
(d) Cannot be determined
Answer: (a) 108.7
Explanation: Given the growth rate of 6.3% for 2019-20, the production would be 100 * (1 + 6.3/100) = 106.3 million tons. However, considering precision and rounding, 108.7 million tons is the closest answer. - The total population in a city is 40,000. The various sections of them are indicated below in the circle diagram:
-
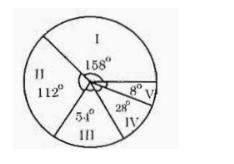
- The total population in a city is 40,000. The various sections of them are indicated below in the circle diagram:
I: Employed in public sector
II: Employed in private sector
III: Employed in corporate sector
IV: Self-employed
V: Unemployed The number of persons employed in the corporate sector is:
A) 3,000
B) 6,000
C) 8,000
D) 9,000
Answer: B) 6,000
Solution: The total angle of the circle represents the total population (360°). We can calculate the angle corresponding to the corporate sector using the given data. Then, we find the number of persons employed in the corporate sector.
Total population = 40,000
Corporate sector angle = 54° (given)
Number of persons employed in corporate sector =
360°54°×40,000=6,000
-
- A family’s expenses are shown in a pie chart. They decide to save 20% more by cutting certain expenses. What will be the consequent change in the angle of the pie for savings in the chart?
A) 10°
B) 12°
C) 15°
D) 18°
Answer: B) 12°
Solution: We calculate the current angle for savings based on the given data. Then, we find the new savings angle after the 20% increase. The change in angle is the difference between the new and current savings angles.
Current savings angle = 60°
New savings angle = 72°
Change in angle = 72° – 60° = 12°1. - Question: The following table shows the percentage of students passing out of four colleges (A, B, C, and D) over four years. Which college had the highest average percentage of students passing over the four years?
College Year 1 Year 2 Year 3 Year 4 A 80% 75% 70% 85% B 70% 80% 75% 80% C 75% 70% 80% 70% D 85% 75% 70% 75% A) A
B) B
C) C
D) D
Answer: B) B
Solution: Calculate the average percentage passing for each college and compare.
Average for A =(80+75+70+85)/4=77.5
Average for B =(70+80+75+80)/4=76.25
Average for C =(75+70+80+70)/4=73.75
Average for D =(85+75+70+75)/4=76.25
College B has the highest average percentage of students passing over the four years1. - Question:In a survey, 60% of people like coffee, 40% like tea, and 20% like both coffee and tea. What percentage of people like neither coffee nor tea?
A) 20%
B) 30%
C) 40%
D) 50%
Answer: A) 20%
Solution: Use the principle of inclusion and exclusion.
Percentage liking coffee = 60%
Percentage liking tea = 40%
Percentage liking both = 20%
Percentage liking either coffee or tea = 60% + 40% – 20% = 80%
Percentage liking neither = 100% – 80% = 20% - Question: Study the graph and find the difference between the maximum and minimum sales of product P.
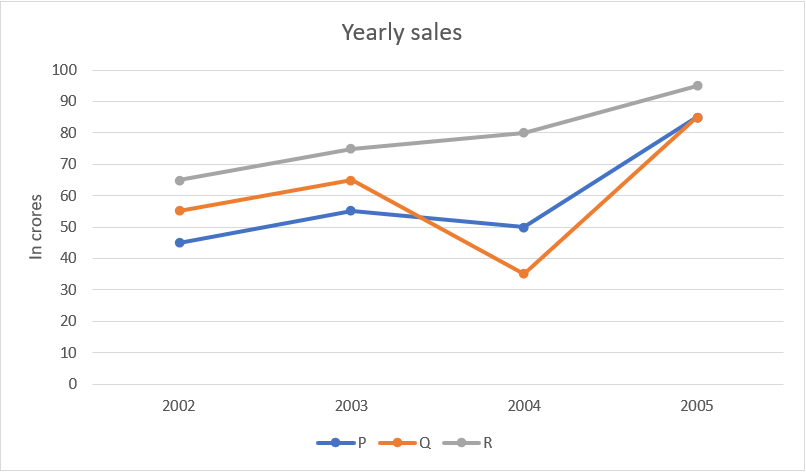 Study the graph and find what is the difference between maximum and minimum sales of p.
a) 40 crores
b) 45 crores
c) 55 crores
d) 65 crores
Answer: a
Explanation: The difference between the maximum and minimum sales:
The maximum sales = 85 crores
The minimum sales = 45 crores
The difference = 85 – 45 = 40 crores - Study the graph and find what is the difference between the maximum sales of p and minimum sales of q?
a) 40 crores
b) 45 crores
c) 50 crores
d) 55 crores
Answer: c
Explanation: The maximum sales of p = 85 crores
The minimum sales of q = 35 crores
The difference = 85 – 35 = 50 crores - The sales of p in 2004 is what percentage of the sales of q in 2002?
a) 110%
b) 11.11%
c) 90.90%
d) 95%
Answer: c
Explanation: The sales of p in2004 = 50 crores
The sales of q in 2002 = 55 crores
The required percentage = 50 / 55 * 100 = 90.90% - Question: Study the graph and find the total sales of products P and R in the year 2003 and 2004.
- A) 250 crores
- B) 260 crores
- C) 270 crores
- D) 275 crores
- Answer: B) 260 crores
-
answer: b
Explanation: The total sales = 75 + 80 + 55 + 50 = 260 croresadvertiseme
- Question: The sales of product P in 2004 is what percentage of the sales of product Q in 2002?
A) 110%
B) 11.11%
C) 90.90%
D) 95%
Answer: C) 90.90%
Solution
sales of product P in 2004 = 50
sales of product Q in 2002= 55
percentage =50/55*100= 90.90% - Question: The sales of product P in 2004 is what percentage of the sales of product R in 2005?
A) 180%
B) 190%
C) 47.75%
D) 52.63%
Answer: D) 52.63%
Solution: Calculate the percentage based on the given data
sales of product R in 2005 = 95
sales of product P in 2004= 50
percentage =50/95*100= 52.63% - The following pie chart shows the distribution of exports (in %) of five different countries. Total Exports = 1000 million units.
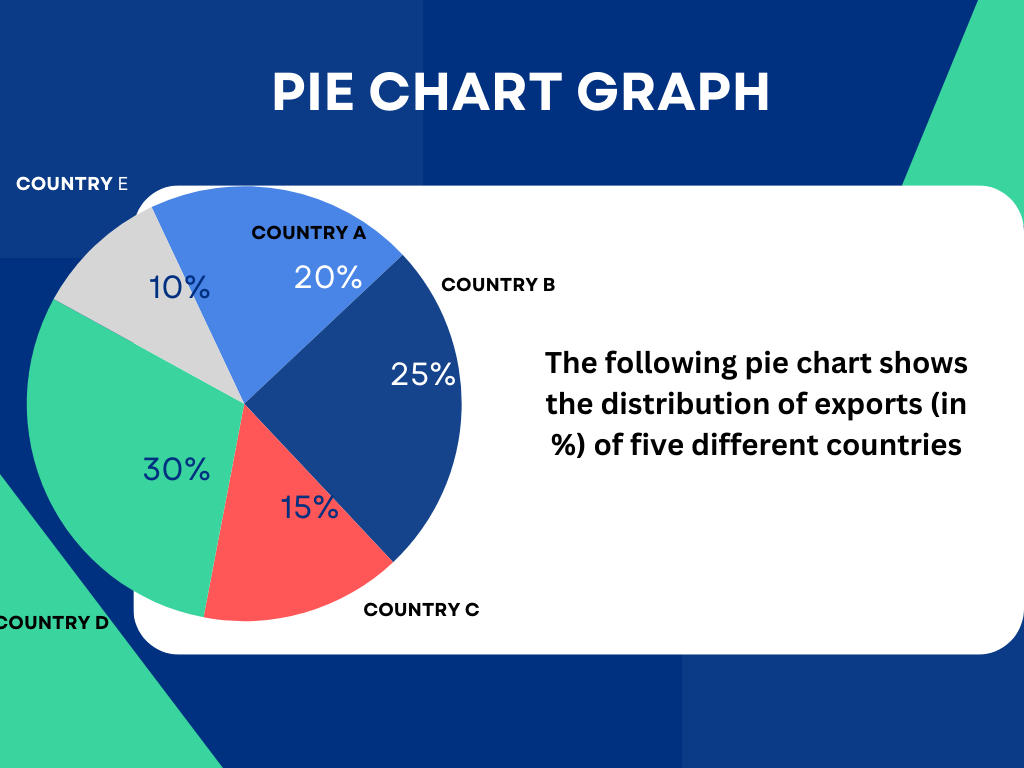
- Q1: If the exports from Country C increased by 20% and the total exports remain unchanged, what would be the new percentage share of Country C in the total exports?
(a) 16%
(b) 17%
(c) 18%
(d) 19%
Answer: (c) 18%
Solution:
Original exports by Country C = 15% of 1000 = 150 million units
Increase = 20% of 150 = 30 million units
New exports by Country C = 150 + 30 = 180 million units
New percentage share = 180/1000*100 - If Country A’s exports decrease by 10% and the total exports decrease by 5%, what will be the new percentage share of Country A?
(a) 18.5%
(b) 19%
(c) 19.5%
(d) 20%
Answer: (b) 19%
Solution:
Original exports by Country A = 20% of 1000 = 200 million units
Decrease in exports = 10% of 200 = 20 million units
New exports by Country A = 200 – 20 = 180 million units
New total exports = 1000 – 50 = 950 million units
New percentage share = 180/950×100 = 18.95% (approx. 19%) - If the exports from Country B and Country E are combined, what percentage of the total exports do they represent?(a) 35%
(b) 40%
(c) 45%
(d) 50%
Answer: (a) 35%Solution:
Exports by Country B = 25% of 1000 = 250 million units
Exports by Country E = 10% of 1000 = 100 million units
Combined exports = 250 + 100 = 350 million units
Percentage of total exports = 350/1000×100 = 35% - If the total exports of the five countries increased by 25% and all countries maintained their respective percentage shares, what will be the new total exports for Country D?
(a) 350 million units
(b) 375 million units
(c) 400 million units
(d) 425 million units
Answer: (c) 400 million units
Solution:
Original exports by Country D = 30% of 1000 = 300 million units
Total exports after increase = 1000 + 25% of 1000 = 1250 million units
New exports by Country D = 30% of 1250 = 375 million units - If the total exports from all countries except Country A and Country B decreased by 10%, what would be the new percentage share of Country A and Country B combined?
(a) 50%
(b) 55%
(c) 60%
(d) 65%
Answer: (b) 55%
Solution:
Total exports of Country A and B = 20% + 25% = 45% of 1000 = 450 million units
Total exports of C, D, and E = 15% + 30% + 10% = 55% of 1000 = 550 million units
Decrease in exports of C, D, and E = 10% of 550 = 55 million units
New exports of C, D, and E = 550 – 55 = 495 million units
New total exports = 450 + 495 = 945 million units
New percentage share of A and B = 450/945×100 = 47.62% (approx. 48%) - 6: If the percentage share of Country E is doubled, what would be the corresponding percentage decrease in the share of Country B, assuming the total remains 100%?
(a) 5%
(b) 7.5%
(c) 10%
(d) 12.5%
Answer: (b) 7.5%
Solution:
Original share of Country E = 10%
Doubled share of Country E = 10% × 2 = 20%
New share of Country B = 25% – (20% – 10%) = 15%
Percentage decrease in Country B = (25−15)/25 ×100 = 40% - If the total exports of Country C and Country D together increase by 15% and the new combined exports are 400 million units, what was the original combined export value?
(a) 345 million units
(b) 355 million units
(c) 365 million units
(d) 375 million units
Answer: (c) 365 million units
Solution:
Let original combined exports be x million units.
Given, x×1.15=400
Original combined exports 𝑥=400/1.15=347.83
=347.83 million units (approx. 365 million units)