

Data interpretation is a crucial aspect of competitive exams like the OSSC CGL (Odisha Staff Selection Commission Combined Graduate Level). To excel in this section, candidates need to have a strong grasp of mathematical concepts and the ability to interpret data accurately. Here, we present a curated list of 30 multiple-choice questions (MCQs) on data interpretation to help you sharpen your skills for the OSSC CGL exam.
Top 30 Data Interpretation MCQs for OSSC CGL
Q(1-5): The following table gives the sales of batteries manufactured by a company over the years. Number of Different Types of Batteries Sold by a Company Over the Years (Numbers in Thousands)
| Year | Types of Batteries | |||||
| 4AH | 7AH | 32AH | 35AH | 55AH | Total | |
| 1992 | 75 | 144 | 114 | 102 | 108 | 543 |
| 1993 | 90 | 126 | 102 | 84 | 126 | 528 |
| 1994 | 96 | 114 | 75 | 105 | 135 | 525 |
| 1995 | 105 | 90 | 150 | 90 | 75 | 510 |
| 1996 | 90 | 75 | 135 | 75 | 90 | 465 |
| 1997 | 105 | 60 | 165 | 45 | 120 | 495 |
| 1998 | 115 | 85 | 160 | 100 | 145 | 605 |
1. What was the approximate percentage increase in the sales of 55AH batteries in 1998 compared to that in 1992?
A. 28%
B. 31%
C. 33%
D. 34%
Answer: D. 34%
Explanation:
2. The total sales of all the seven years is the maximum for which battery?
A. 4AH
B. 7AH
C. 32AH
D. 35AH
Answer: C. 32AH
Explanation: The total sales (in thousands) of all the seven years for various batteries are:
For 4AH = 75 + 90 + 96 + 105 + 90 + 105 + 115 = 676
For 7AH = 144 + 126 + 114 + 90 + 75 + 60 + 85 = 694
For 32AH = 114 + 102 + 75 + 150 + 135 + 165 + 160 = 901
For 35AH = 102 + 84 + 105 + 90 + 75 + 45 + 100 = 601
For 55AH = 108 + 126 + 135 + 75 + 90 + 120 + 145 = 799.
Clearly, sales are maximum in case of 32AH batteries.
3. What is the difference in the number of 35AH batteries sold in 1993 and 1997?
A. 24,000
B. 28,000
C. 35,000
D. 39,000
Answer: D. 39,000
Explanation: Required difference = [(84 – 45) x 1000] = 39000.
4. The percentage of 4AH batteries sold to the total number of batteries sold was maximum in which year?
A. 1994
B. 1995
C. 1996
D. 1997
Answer: D. 1997
Explanation:
For 1992 = (75/543 x 100)% = 13.81%.
For 1993 = (90/528 x 100)% = 17.05%.
For 1994 = (96/525 x 100)% = 18.29%.
For 1995 = (105/510x 100)% = 20.59%.
For 1996 = (96/465 x 100)% = 19.35%.
For 1997 = (105/495 x 100)% = 21.21%.
For 1998 = (115/605 x 100)% = 19.01%.
Clearly, the percentage is maximum in 1997.
5. In the case of which battery was there a continuous decrease in sales from 1992 to 1997?
A. 4AH
B. 7AH
C. 32AH
D. 35AH
Answer: B. 7AH
Explanation: From the table it is clear that the sales of 7AH batteries have been decreasing continuously from 1992 to 1997.
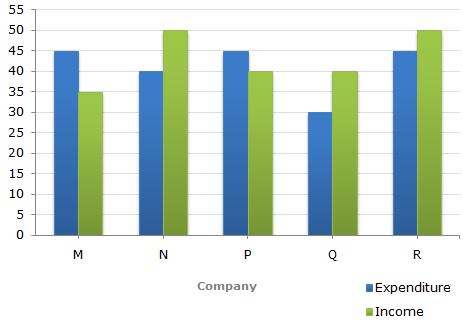
Q(6-10): The following bar graph shows the Income and Expenditures (in million US $) of five companies in the year 2001. The percent profit or loss of a company is given by ( % Profit/Loss =Income – Expenditure/ Expenditure x 100) Income and Expenditure (in million US $) of five companies in the year 2001.
6. The companies M and N together had a percentage of profit/loss of?
A) 12% loss
B) 10% loss
C) 10% profit
D) There was no loss or profit
Answer: D
Explanation:
Total income of Companies M and N together
= (35 + 50) million US $
= 85 million US $
Total expenditure of Companies M and N together
= (45 + 40) million US $
= 85 million US $.
Therefore Percent Profit/Loss of companies M and N together
% Profit/Loss = (85 – 85/85 x 100) = 0%.
Thus, there was neither loss nor profit for companies M and N together
7. In 2001, what was the approximate percentage of profit/loss of all the five Companies taken together?
A) 5% profit
B) 6.5% profit
C) 4% loss
D) 7% loss
Answer: A
Explanation:
Total income of all five companies
= (35 + 50 + 40 + 40 + 50) million US $
= 215 million US $.
Total expenditure of all five companies
= (45 + 40 + 45 + 30 + 45) million US $
= 205 million US $.
Therefore % Profit = [(215 – 205)/205 x 100] % = 4.88% ~= 5%.
8. Which company earned the maximum percentage profit in the year 2001?
A) M
B) N
C) P
D) Q
Answer: D
Explanation: The percentage profit/loss in the year 2001 for various comapanies are:
For M =[ (35 – 45)/ 45 x 100 ] % = -22.22% i.e., Loss = 22.22%.
For N = [(50 – 40)/ 40 x 100] % = 25% i.e., Profit = 25%.
For P = [ (40 – 45)/45 x 100] % = -11.11% i.e., Loss = 11.11%.
For Q = [(40 – 30)/30 x 100] % = 33.33% i.e., Profit = 33.33%.
For R =[(50 – 45)/45 x 100]% = 11.11% i.e., Profit = 11.11%.
Clearly, the Company Q earned the maximum profit in 2001.
9. For Company R, if the expenditure had increased by 20% in year 2001 from year 2000 and the company had earned a profit of 10% in 2000, what was the Company’s income in 2000 (in million US $)?
A) 35.75
B) 37.25
C) 38.5
D) 41.25
Answer: D
Explanation: Let the expenditure of Company R in 2000 be X million US $.
Then, expenditure of Company R in 2001 = (120/100x X) million US $.
Therefore 120X/100 = 45 => X = 37.5.
i.e., expenditure of Company R in 2000 = 37.5 million US $.
Let the income of Company R in 2000 be I million US $.
Then, 10 = (I – 37.5)/ 37.5 x 100 [ %Profit in 2000 = 10%]
=> I – 37.5 = 3.75
=> I = 41.25
i.e., Income of Company R in 2000 = 41.25 million US $.
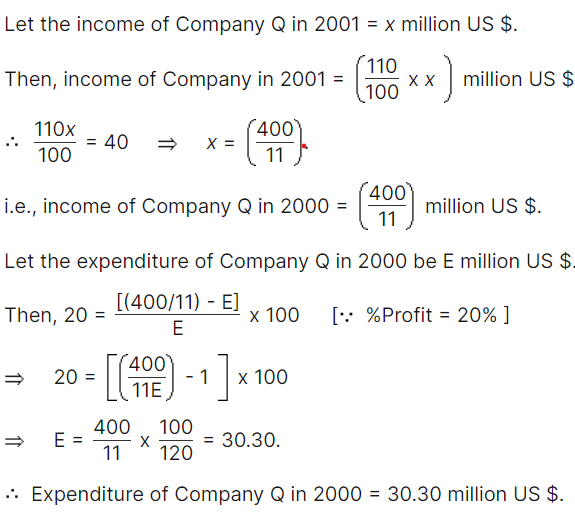
10. If the income of Company Q in 2001 was 10% more than its income in 2000 and the Company had earned a profit of 20% in 2000, then its expenditure in 2000 (in million US $) was?
A) 28.28
B) 30.30
C) 32.32
D) 34.34
Answer: B
Explanation:
Q(11-13): The following pie chart give the information about the distribution of weight in the human body according to different kinds of components. Study the pie charts and answer the question.
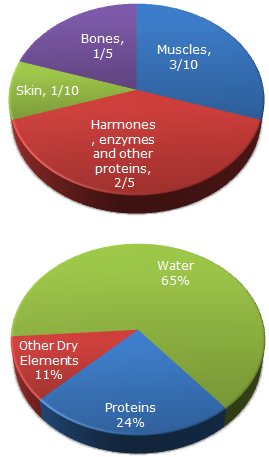
11. What percentage of proteins in the human body is equivalent to the weight of its skin?
A) 41.66%
B) 43.33%
C) 44.44%
D) Cannot be determined
Answer: A) 41.66%
Explanation:
Total percentage = (10 / 24) x 100 = 41.6666667 %
12. How much of the human body is neither made of bones nor skin?
A) 40%
B) 50%
C) 60%
D) 70%
Answer: D) 70%
Explanation:
20% (bones) + 10% (skin) = 30% of the body is made up of either bones or skin. Hence, 70% is made up of neither.
13. What is the ratio of the distribution of proteins in the muscles to that of the distribution of proteins in the bones?
A) 2:1
B) 2:3
C) 3:2
D) Cannot be determined
Answer: D) Cannot be determined
Explanation:
It cannot be determined since the respective distributions are not known.
Q(14-15): The following pie charts display the distribution of overseas tourist traffic from India. The first chart illustrates the tourist distribution by country, while the second chart presents the age profiles of these tourists.

14. The ratio of the number of Indian tourists that went to the USA to the number of Indian tourists who were below 30 years of age is:
a) 2:1
b) 8:3
c) 3:8
d) Cannot be determined
Answer: Option b) 8:3
Explanation:
Given ratio is 40:15, which simplifies to 8:3.
15. If amongst other countries, Switzerland accounted for 25% of the Indian tourist traffic, and it is known from official Swiss records that a total of 25 lakh Indian tourists had gone to Switzerland during the year, then find the number of 30-39 year old Indian tourists who went abroad in that year:
a) 18.75 lakh
b) 25 lakh
c) 50 lakh
d) 75 lakh
Answer: Option d) 75 lakh
Explanation: Tourist traffic from other countries to Swiz is 20%.
Amongst this 20%, 25% of traffic from India.
So, 25% of 20% = 5% corresponds to the Indian traffic in Switzerland.
5 % corresponds to Switzerland’s 25 lakh. Hence 15% will be 75 lakh.
Q(16-20): The line graph illustrates the ratio of a company’s imports to its exports from 1995 to 2001. This shows how the import-export balance of the company has evolved over the years.
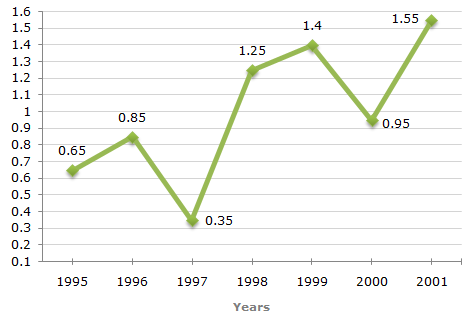
16. What was the imports in 1999, given that imports in 1998 were Rs. 250 crores and the total exports in 1998 and 1999 together was Rs. 500 crores?
A) Rs. 250 crores
B) Rs. 300 crores
C) Rs. 357 crores
D) Rs. 420 crores
Answer: B) Rs. 300 crores
Explanation: The ratio of imports to exports for the years 1998 and 1999 are 1.25 and 1.40 respectively.
Let the exports in the year 1998 = Rs. x crores.
Then, the exports in the year 1999 = Rs. (500 – x) crores.
Therefore 1.25 = 250/ X => x =250/ 1.25= 200 [Using ratio for 1998]
Thus, the exports in the year 1999 = Rs. (500 – 200) crores = Rs. 300 crores.
Let the imports in the year 1999 = Rs. y crores.
Then, 1.40 = y/300 => y = (300 x 1.40) = 420.
Therefore Imports in the year 1999 = Rs. 420 crores.
17. In which year were the imports minimum proportionate to the exports of the company?
A) 1995
B) 1996
C) 1997
D) 2000
Answer: C) 1997
Explanation: The imports are minimum proportionate to the exports implies that the ratio of the value of imports to exports has the minimum value.
Now, this ratio has a minimum value 0.35 in 1997, i.e., the imports are minimum proportionate to the exports in 1997.
18. What was the percentage increase in imports from 1997 to 1998?
A) 72
B) 56
C) 28
D) Data inadequate
Answer: D) Data inadequate
Explanation: The graph gives only the ratio of imports to exports for different years. To find the percentage increase in imports from 1997 to 1998, we require more details such as the value of imports or exports during these years.
Hence, the data is inadequate to answer this question.
19. If the imports of the company in 1996 was Rs. 272 crores, what were the exports from the company in 1996?
A) Rs. 370 crores
B) Rs. 320 crores
C) Rs. 280 crores
D) Rs. 275 crores
Answer: B) Rs. 320 crores
Explanation: Ratio of imports to exports in the year 1996 = 0.85.
Let the exports in 1996 = Rs. x crores.
Then, 272/X = 0.85 => x = 272/0.85 = 320.
Therefore Exports in 1996 = Rs. 320 crores.
20. In how many of the given years were the exports more than the imports?
A) 1
B) 2
C) 3
D) 4
Answer: D) 4
Explanation:
Exports greater than imports ratio in 1995, 1996, 1997, and 2000
Study the following bar graph and answer the questions that follow: Total monthly income = Rs. 50,000
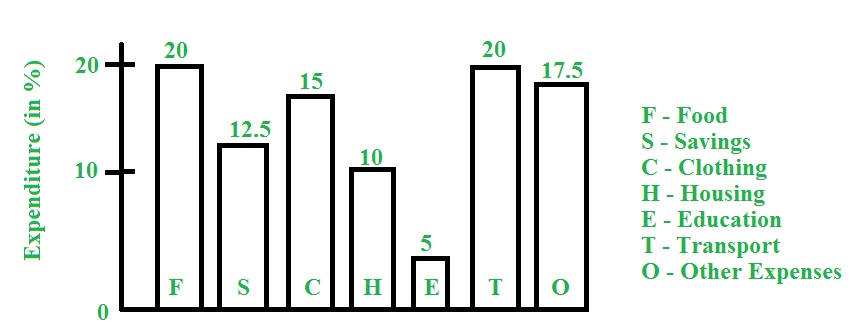
21. What amount is spent on food ?
A. Rs. 11,000
B. Rs. 12,000
C. Rs. 10,000
D. Rs. 15,000
Answer: C. Rs. 10,000
Sol: Food = 20 % of expenditure => Amount spent on food = 20% of 50,000 = Rs. 10,000
22. How much more money is spent on clothing and housing together than on transportation?
A. 3500
B. 4500
C. 5500
D. 2500
Answer: C. 2500
Sol: Money spent on clothing and housing together = 25 % of Rs. 50,000 = Rs. 12,500 Money spent on transportation = 20 % of Rs. 50,000 = Rs. 10,000 Therefore, more money spent on clothing and housing together than on transportation = Rs. 12,500-10,000 = Rs. 2,500
23. What percent of amount on food is spent as amount on education?
A. 26 %
B. 30 %
C. 35 %
D. 25 %
Answer: D. 25 %
Sol: Expenditure on food = 20 % Expenditure on education = 5 % Therefore, percent of amount on food spent as amount on education = (5 / 20) x 100 = 25 %
Q(24-26) study the pie chart below and answer the questions that follow :
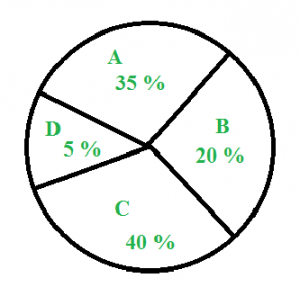
The above pie chart shows the sales of four different types of articles in a shop.
24. What is the central angle of type A ?
A. 126 degrees
B. 140 degrees
C. 155 degrees
D. 150 degrees
Ans: A. 126 degrees
Sol: Central angle of A = Percentage of A x 360 degrees = (35 / 100) x 360 = 126 degrees
25. If the total sale is 1200, what is the sale of B ?
A. 280
B. 270
C. 250
D. 240
Ans:
Sol: Sales of B = 20 % of 1200 = 240
26. What is the difference between the central angle of C and D ?
A. 123 degrees
B. 126 degrees
C. 130 degrees
D. 135 degrees
Ans: B. 126 degrees
Sol: Difference between the central angle of C and D = 40 % of 360 – 5 % of 360 = 35 % of 360 = 126 degrees
Q26-30): Study the following table and answer the questions. Classification of 100 Students Based on the Marks Obtained by them in Physics and Chemistry in an Examination.
| Subject | Marks out of 50 | ||||
| 40 and above | 30 and above | 20 and above | 10 and above | 0 and above | |
| Physics | 9 | 32 | 80 | 92 | 100 |
| Chemistry | 4 | 21 | 66 | 81 | 100 |
| Average (Aggregate) | 7 | 27 | 73 | 87 | 100 |
26. What is the difference between the number of students who passed with 30 as the cut-off marks in Chemistry and those who passed with 30 as the cut-off marks in aggregate?
A) 3
B) 4
C) 5
D) 6
Answer: D) 6
Sol: Required difference
= (No. of students scoring 30 and above marks in Chemistry)
– (Number of students scoring 30 and above marks in aggregate)
= 27 – 21
= 6.
27. If at least 60% marks in Physics are required for pursuing higher studies in Physics, how many students will be eligible to pursue higher studies in Physics?
A) 27
B) 32
C) 34
D) 41
Answer: B) 32
Sol: We have 60% of 50 =(60/100 x 50 ) = 30.
Therefore Required number
= No. of students scoring 30 and above marks in Physics
= 32
28. What is the percentage of the number of students getting at least 60% marks in Chemistry over those getting at least 40% marks in aggregate, approximately?
A) 21%
B) 27%
C) 29%
D) 31%
Answer: C) 29%
Sol: Number of students getting at least 60% marks in Chemistry
= Number of students getting 30 and above marks in Chemistry
= 21.
Number of students getting at least 40% marks in aggregate
= Number of students getting 20 and above marks in aggregate
= 73.
Required percentage
=(21/73x 100) %
= 28.77%
~= 29%.
29. How many students scored less than 40% marks in aggregate?
A) 13
B) 19
C) 20
D) 27
Answer: D) 27
Sol: We have 40% of 50 =(40/100 x 50 )= 20.
Therefre Required number
= Number of students scoring less than 20 marks in aggreagate
= 100 – Number of students scoring 20 and above marks in aggregate
= 100 – 73
= 27.
30. What is the minimum qualifying marks range in Chemistry for eligibility to the Symposium on Chemistry, if at least 23 students were eligible?
A) 40-45
B) 30-40
C) 20-30
D) Below 20
Answer: C) 20-30
Explanation:
Since 66 students get 20 and above marks in Chemistry and out of these 21 students get 30 and above marks, therefore to select top 35 students in Chemistry, the qualifying marks should lie in the range 20-30.