

Data interpretation is a crucial aspect of competitive exams like the OSSC CGL (Odisha Staff Selection Commission Combined Graduate Level). To excel in this section, candidates need to have a strong grasp of mathematical concepts and the ability to interpret data accurately. Here, we present a curated list of 30 multiple-choice questions (MCQs) on data interpretation to help you sharpen your skills for the OSSC CGL exam.
Top 30 Data Interpretation MCQs for OSSC CGL
Two different finance companies, P and Q, offer fixed annual interest rates on investments. These rates can vary each year, influenced by the country’s economic conditions and prevailing bank interest rates. The line graph below illustrates the annual interest rates provided by Companies P and Q over the years.
Annual Rate of Interest Offered by Two Finance Companies Over the Years.
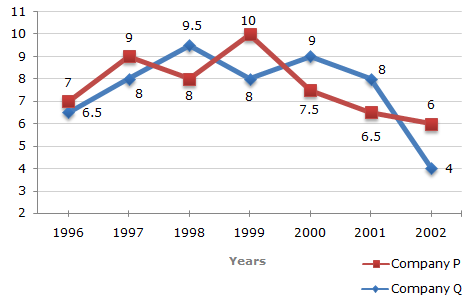
- A sum of Rs. 4.75 lakhs was invested in Company Q in 1999 for one year. How much more interest would have been earned if the sum was invested in Company P?
a) Rs. 19,000
b) Rs. 14,250
c) Rs. 11,750
d) Rs. 9,500
Answer: d) Rs. 9,500
Explanation:
Difference = Rs. [(10% of 4.75) – (8% of 4.75)] lakhs
= Rs. (2% of 4.75) lakhs
= Rs. 0.095 lakhs
= Rs. 9,500. - If two different amounts in the ratio 8:9 are invested in Companies P and Q respectively in 2002, then the amounts received after one year as interests from Companies P and Q are respectively in the ratio?
a) 2:3
b) 3:4
c) 6:7
d) 4:3
Answer: d) 4:3
Explanation:
Let the amounts invested in 2002 in Companies P and Q be Rs. 8x and Rs. 9x respectively.
Interest received from Company P = Rs. (6% of 8x) = Rs. 0.48x
Interest received from Company Q = Rs. (4% of 9x) = Rs. 0.36x
Therefore, the ratio of interests = (0.48x) / (0.36x) = 4:3. - In 2000, a part of Rs. 30 lakhs was invested in Company P and the rest was invested in Company Q for one year. The total interest received was Rs. 2.43 lakhs. What was the amount invested in Company P?
a) Rs. 9 lakhs
b) Rs. 11 lakhs
c) Rs. 12 lakhs
d) Rs. 18 lakhs
Answer: d) Rs. 18 lakhs
Explanation:
Let Rs. x lakhs be invested in Company P and Rs. (30 – x) lakhs in Company Q.
Total interest = Rs. [(7.5% of x) + (9% of (30 – x))] lakhs
= Rs. [(0.075x) + (2.7 – 0.09x)]
= 2.7 – 0.015x = 2.43
Solving, x = 18 lakhs. - An investor invested a sum of Rs. 12 lakhs in Company P in 1998. The total amount received after one year was re-invested in the same Company for one more year. The total appreciation received by the investor on his investment was?
a) Rs. 2,96,200
b) Rs. 2,42,200
c) Rs. 2,25,600
d) Rs. 2,16,000
Answer: c) Rs. 2,25,600
Explanation:
Amount received from Company P after one year on Rs. 12 lakhs
= Rs. [12 + (8% of 12)] lakhs
= Rs. 12.96 lakhs.
Amount received after re-investing Rs. 12.96 lakhs
= Rs. [12.96 + (10% of 12.96)] lakhs
= Rs. 14.256 lakhs.
Appreciation = Rs. (14.256 – 12) lakhs
= Rs. 2.256 lakhs
= Rs. 2,25,600. - An investor invested Rs. 5 lakhs in Company Q in 1996. After one year, the entire amount along with the interest was transferred as investment to Company P in 1997 for one year. What amount will be received from Company P, by the investor?
a) Rs. 5,94,550
b) Rs. 5,80,425
c) Rs. 5,77,800
d) Rs. 5,77,500
Answer: b) Rs. 5,80,425
Explanation:
Amount received from Company Q after one year on Rs. 5 lakhs
= Rs. [5 + (6.5% of 5)] lakhs
= Rs. 5.325 lakhs.
Amount received from Company P after one year on Rs. 5.325 lakhs
= Rs. [5.325 + (9% of 5.325)] lakhs
= Rs. 5.80425 lakhs
= Rs. 5,80,425.
Study the following graph and the table and answer the questions given below.
Data of different states regarding population of states in the year 1998
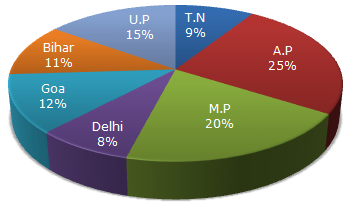
Total population of the given States = 3276000.
| States | Sex and Literacy wise Population Ratio | |||
| Sex | Literacy | |||
| M | F | Literate | Illiterate | |
| A.P | 5 | 3 | 2 | 7 |
| M.P | 3 | 1 | 1 | 4 |
| Delhi | 2 | 3 | 2 | 1 |
| Goa | 3 | 5 | 3 | 2 |
| Bihar | 3 | 4 | 4 | 1 |
| U.P. | 3 | 2 | 7 | 2 |
| T.N. | 3 | 4 | 9 | 4 |
- What will be the percentage of total number of males in U.P., M.P. and Goa together to the total population of all the given states?
- 25%
- 27.5%
- 28.5%
- 31.5%
Answer: 28.5%
Explanation: Total number of males in U.P., M.P., and Goa = (9 + 15 + 4.5) x N / 100, where N = 3276000. Hence, the required percentage is 28.5%.
- What was the total number of illiterate people in A.P. and M.P. in 1998?
- 876040
- 932170
- 981550
- 1161160
Answer: 1161160
Explanation: Number of illiterate people in A.P. = 637000 and in M.P. = 524160. Therefore, total = 637000 + 524160 = 1161160.
- What is the ratio of the number of females in T.N. to the number of females in Delhi?
- 7 : 5
- 9 : 7
- 13 : 11
- 15 : 14
Answer: 15 : 14
Explanation: Ratio of females in T.N. to Delhi = (4/7) x (9% of 3276000) / (3/5) x (8% of 3276000) = 15 : 14.
- What was the number of males in U.P. in the year 1998?
- 254650
- 294840
- 321470
- 341200
Answer: 294840
Explanation: Number of males in U.P. = (3/5) x (15% of 3276000) = 294840.
- If in the year 1998, there was an increase of 10% in the population of U.P. and 12% in the population of M.P. compared to the previous year, then what was the ratio of populations of U.P. and M.P. in 1997?
- 42 : 55
- 48 : 55
- 7 : 11
- 4 : 5
Answer: 42 : 55
Explanation: Let x be the population of U.P. and y be the population of M.P. in 1997. Ratio of populations of U.P. and M.P. in 1998 = 110x / 112y. Given from the chart, this ratio is 15 / 20, leading to the ratio in 1997 as 42 : 55.
Study the following pie-diagrams carefully and answer the questions given below it:
Percentage Composition of Human Body
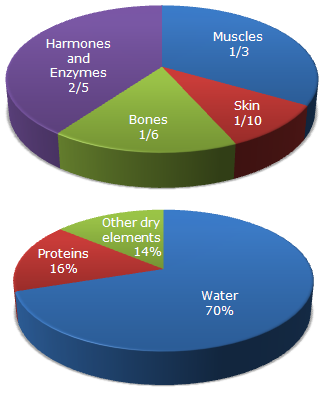
- What percent of the total weight of the human body is equivalent to the weight of the proteins in skin in the human body?
- 0.016
- 1.6
- 0.16
- Data inadequate
Answer: 1.6
Explanation: The weight of proteins in the skin is calculated as 16% of the total body weight. So, if the body weight is ‘x’ kg, then the weight of skin proteins = (16/100) * x kg = 0.16 * x kg. To find the percentage of skin proteins relative to the total body weight: (0.16 * x / x) * 100% = 1.6%.
- What will be the quantity of water in the body of a person weighing 50 kg?
- 20 kg
- 35 kg
- 41 kg
- 42.5 kg
Answer: 35 kg
Explanation: Water constitutes 70% of the body weight. For a person weighing 50 kg, the quantity of water = 0.70 * 50 kg = 35 kg.
- What is the ratio of the distribution of proteins in the muscles to that of the distribution of proteins in the bones?
- 1 : 18
- 1 : 2
- 2 : 1
- 18 : 1
Answer: 2 : 1
Explanation: Proteins in muscles are 16% of body weight, while in bones, they are 8% of body weight. Ratio = (16/8) = 2 : 1.
- To show the distribution of proteins and other dry elements in the human body, the arc of the circle should subtend at the center an angle of:
- 54°
- 126°
- 108°
- 252°
Answer: 108°
Explanation: Proteins and other dry elements together constitute 30% of the body weight. Therefore, the central angle corresponding to these elements = 30% of 360° = 108°.
- In the human body, what part is made of neither bones nor skin?
- 1/40
- 3/80
- 2/5
- None of these
Answer: None of these
Explanation: To find the part made of neither bones nor skin, subtract the percentage of bones (14%) and skin (16%) from 100%: 100% – (14% + 16%) = 70%.
Study the following bar charts and answer the questions.
Foreign Trade (Imports and Exports) by countries for the year (1993 – 1994)
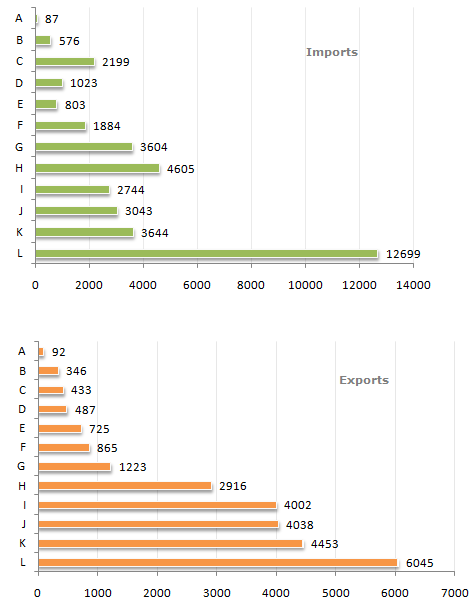
- The ratio of the maximum exports to the minimum imports was closest to:
A) 64
B) 69
C) 74
D) 79
Answer: B) 69
Explanation: The maximum exports were 6045, and the minimum imports were 87. Therefore, the ratio of maximum exports to minimum imports is
6045 / 87 ≈69. - How many countries exhibited a trade surplus?
A) 5
B) 4
C) 3
D) 6
Answer: B) 4
Explanation: Out of 12 countries, 4 showed a trade surplus while the remaining 8 had a deficit. - The total trade deficit/surplus for all the countries put together was:
A) 11286 surplus
B) 11286 deficit
C) 10286 deficit
D) None of these
Answer: B) 11286 deficit
Explanation: The total trade deficit is calculated as the sum of exports minus the sum of imports, which is 11286 deficit. - The highest trade deficit was shown by which country?
A) C
B) G
C) H
D) L
Answer: D) L
Explanation: L had the highest trade deficit among all the countries. - The ratio of Exports to Imports was highest for which country?
A) A
B) I
C) J
D) K
Answer: B) I
Explanation: Country I had the highest ratio of exports to imports, calculated as
4002/2744 ≈1.45, which is the highest among all countries.
“The line graph below illustrates the percentage of candidates who qualified an examination out of the total number who appeared for it from 1994 to 2000.”
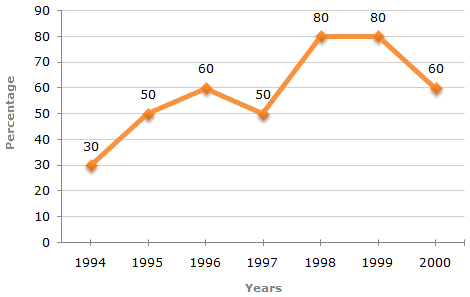
- Among the following pairs of years, in which pair was the difference between the percentage of candidates qualified to appear the maximum?
- 1994 and 1995
- 1997 and 1998
- 1998 and 1999
- 1999 and 2000
Answer: The maximum difference is between the years 1997 and 1998.
Explanation:
For 1994 and 1995: Difference = 50 – 30 = 20.
For 1998 and 1999: Difference = 80 – 80 = 0.
For 1997 and 1998: Difference = 80 – 50 = 30.
For 1999 and 2000: Difference = 80 – 60 = 20.
Thus, the maximum difference is between 1997 and 1998.
- In which pair of years was the number of candidates qualified the same?
- 1995 and 1997
- 1995 and 2000
- 1998 and 1999
- Data inadequate
Answer: Data inadequate.
Explanation: Without the absolute number of candidates qualified or the candidates appeared, we cannot compare the exact numbers for any two years.
- If the number of candidates qualified in 1998 was 21,200, what was the number of candidates appeared in 1998?
- 32,000
- 28,500
- 26,500
- 25,000
Answer: 26,500.
Explanation:
Let the number of candidates appeared in 1998 be x.
80% of x = 21,200
Solving for x: x = (21,200 * 100) / 80 = 26,500.
- If the total number of candidates appeared in 1996 and 1997 together was 47,400, what was the total number of candidates qualified in these two years together?
- 34,700
- 32,100
- 31,500
- Data inadequate
Answer: Data inadequate.
Explanation: We need additional data such as the number of candidates appeared or the percentage of candidates qualified to determine the total number of candidates qualified.
- The total number of candidates qualified in 1999 and 2000 together was 33,500, and the number of candidates appeared in 1999 was 26,500. What was the number of candidates in 2000?
- 24,500
- 22,000
- 20,500
- 19,000
Answer: 20,500.
Explanation:
Candidates qualified in 1999 = 80% of 26,500 = 21,200.
Candidates qualified in 2000 = Total qualified in 1999 and 2000 – Qualified in 1999
= 33,500 – 21,200 = 12,300.
Let the number of candidates appeared in 2000 be x.
60% of x = 12,300
Solving for x: x = (12,300 * 100) / 60 = 20,500.
Cumulative Trade Deficit/Surplus of Countries for the Year 2006 – 2007 (All figures in Rs. Crores):
- Total of the first three deficit countries: 3594.3
- Total of the next five deficit countries: 2588.5
- Total of the last five deficit countries: 334.2
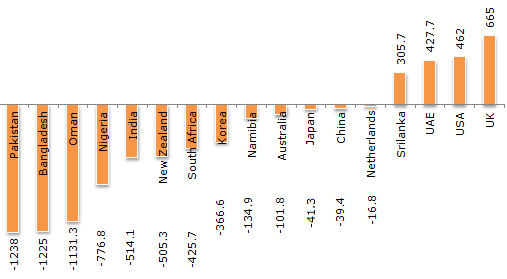
- The ratio between the difference between the highest and the lowest of the surplus countries to the difference between Bangladesh and Oman is?
A) 3.44
B) 2.96
C) 4.5
D) 3.83
Answer: A) 3.44
Explanation: The required ratio is
360/ 94 =3.829 which rounds to 3.83, closest to option A. - The average of the total deficit of the middle five deficit is closest to the deficit of which country?
A) Korea
B) South Africa
C) UAE
D) None of these
Answer: A) Korea
Explanation: The middle five deficit countries are India, New Zealand, South Africa, Korea, and Namibia. Their average deficit is
1946.6/ 5 = 389.32 which is closest to Korea’s deficit. - The state whose surplus is nearly equal to the average of the four surplus countries is:
A) Sri Lanka
B) UAE
C) USA
D) UK
Answer: C) USA
Explanation: The average trade surplus of the four countries is
1860.4/ 4 = 465.1 Among the options, USA has the closest surplus value. - The ratio of the deficit of the first five deficit countries to the overall deficit of all the deficit countries is nearly equal to?
A) 0.72
B) 0.75
C) 0.80
D) 0.85
Answer: B) 0.75
Explanation: The ratio is
4885.2/6517 ≈ 0.7496 which rounds to 0.75, matching option B. - The net total deficit/surplus is equal to?
A) 4656.6 surplusData interpretation is a crucial aspect of competitive exams like the OSSC CGL (Odisha Staff Selection Commission Combined Graduate Level). To excel in exam
B) 4656.6 deficit
C) 3836.5 deficit
D) None of these
Answer: B) 4656.6 deficit
Explanation: Summing all surpluses and subtracting all deficits gives an overall deficit of 4656.6, matching option B.