

Data interpretation is a crucial aspect of competitive exams like the OSSC CGL (Odisha Staff Selection Commission Combined Graduate Level). To excel in this section, candidates need to have a strong grasp of mathematical concepts and the ability to interpret data accurately. Here, we present a curated list of 30 multiple-choice questions (MCQs) on data interpretation to help you sharpen your skills for the OSSC CGL exam.
Top 30 Data Interpretation MCQs for OSSC CGL
Table 1: Production of different crops by a farming company in the year 2022 (in tons)
| Crop | Q1 | Q2 | Q3 | Q4 |
| Wheat | 500 | 600 | 650 | 700 |
| Rice | 400 | 550 | 620 | 680 |
| Corn | 300 | 450 | 500 | 600 |
| Soybean | 200 | 350 | 400 | 450 |
- What was the total production of Wheat in 2022?
- a) 2300 tons
- b) 2400 tons
- c) 2450 tons
- d) 2500 tons
Answer: c) 2450 tons
Solution: From the table, the production of Wheat in Q1 = 500, Q2 = 600, Q3 = 650, and Q4 = 700 tons. Adding these, we get the total production of Wheat in 2022 as 500 + 600 + 650 + 700 = 2450 tons.
2. In which quarter did the company have the highest production of Rice?
a) Q1
b) Q2
c) Q3
d) Q4
Answer: d) Q4
Solution: From the table, the production of Rice in Q4 was 680 tons, which is the highest among all quarters.
3. If the company had to increase the production of Corn by 20% in Q4, what would be the new production figure for Corn in that quarter?
a) 660 tons
b) 690 tons
c) 720 tons
d) 750 tons
Answer: c) 720 tons
Solution: The production of Corn in Q4 was 600 tons. A 20% increase would be 0.2 × 600 = 120 tons. Therefore, the new production figure for Corn in Q4 would be 600 + 120 = 720 tons.
4. What was the difference between the highest and lowest quarterly production of Soybean in 2022?
a) 150 tons
b) 200 tons
c) 250 tons
d) 300 tons
Answer: c) 250 tons
Solution: From the table, the highest quarterly production of Soybean was 450 tons (in Q4), and the lowest was 200 tons (in Q1). The difference between the highest and lowest quarterly production of Soybean is 450 – 200 = 250 tons.
5..If the company had to reduce the production of Wheat by 25% in Q2, what would be the new production figure for Wheat in that quarter?
a) 400 tons
b) 450 tons
c) 500 tons
d) 550 tons
Answer: b) 450 tons
Solution: The production of Wheat in Q2 was 600 tons. A 25% reduction would be 0.25 × 600 = 150 tons. Therefore, the new production figure for Wheat in Q2 would be 600 – 150 = 450 tons.
Table 2: Sales of different products by a retail store in the year 2022 (in thousand units)
| Product | Q1 | Q2 | Q3 | Q4 |
| Electronics | 10 | 15 | 18 | 22 |
| Clothing | 8 | 12 | 10 | 16 |
| Books | 6 | 9 | 12 | 14 |
| Toys | 4 | 6 | 8 | 10 |
6. What was the total sales of Electronics in 2022?
a) 60 thousand units
b) 62 thousand units
c) 65 thousand units
d) 68 thousand units
Answer: c) 65 thousand units
Solution: From the table, the sales of Electronics in Q1 = 10, Q2 = 15, Q3 = 18, and Q4 = 22 thousand units. Adding these, we get the total sales of Electronics in 2022 as 10 + 15 + 18 + 22 = 65 thousand units.
7. In which quarter did the store have the highest sales of Clothing?
a) Q1
b) Q2
c) Q3
d) Q4
Answer: d) Q4
Solution: From the table, the sales of Clothing in Q4 were 16 thousand units, which is the highest among all quarters.
8. If the store had to increase the sales of Books by 30% in Q4, what would be the new sales figure for Books in that quarter?
a) 16 thousand units
b) 17 thousand units
c) 18 thousand units
d) 19 thousand units
Answer: c) 18 thousand units
Solution: The sales of Books in Q4 were 14 thousand units. A 30% increase would be 0.3 × 14 = 4.2 thousand units. Therefore, the new sales figure for Books in Q4 would be 14 + 4.2 = 18 thousand units.
9. What was the ratio of sales of Toys to sales of Clothing in Q2?
a) 1:2
b) 2:3
c) 1:2.5
d) 1:3
Answer: a) 1:2
Solution: From the table, the sales of Toys in Q2 were 6 thousand units, and the sales of Clothing were 12 thousand units. The ratio of these two values is 6:12, which can be simplified to 1:2.
10. If the store had to reduce the sales of Electronics by 40% in Q3, what would be the new sales figure for Electronics in that quarter?
a) 9 thousand units
b) 10 thousand units
c) 11 thousand units
d) 12 thousand units
Answer: a) 9 thousand units
Solution: The sales of Electronics in Q3 were 18 thousand units. A 40% reduction would be 0.4 × 18 = 7.2 thousand units. Therefore, the new sales figure for Electronics in Q3 would be 18 – 7.2 = 10.8 thousand units (approximately 9 thousand units).
Table 3: Number of employees in different departments of a company in the year 2022
| Department | Q1 | Q2 | Q3 | Q4 |
| Marketing | 50 | 60 | 70 | 80 |
| Finance | 40 | 45 | 50 | 55 |
| IT | 30 | 35 | 40 | 45 |
| Human Resources | 20 | 25 | 30 | 35 |
11. What was the total number of employees in the company in Q4?
a) 190
b) 200
c) 210
d) 215
Answer: d) 215
Solution: From the table, the number of employees in Q4 in Marketing = 80, Finance = 55, IT = 45, and Human Resources = 35. Adding these, we get the total number of employees in the company in Q4 as 80 + 55 + 45 + 35 = 215.
12. In which quarter did the IT department have the lowest number of employees?
a) Q1
b) Q2
c) Q3
d) Q4
Answer: a) Q1
Solution: From the table, the number of employees in the IT department in Q1 was 30, which is the lowest among all quarters.
13. If the company had to increase the number of employees in the Finance department by 20% in Q4, what would be the new number of employees in that department in that quarter?
a) 60
b) 62
c) 64
d) 66
Answer: c) 64
Solution: The number of employees in the Finance department in Q4 was 55. A 20% increase would be 0.2 × 55 = 11. Therefore, the new number of employees in the Finance department in Q4 would be 55 + 11 = 66.
14. What was the difference between the highest and lowest number of employees in the Human Resources department in 2022?
a) 10
b) 12
c) 15
d) 18
Answer: c) 15
Solution: From the table, the highest number of employees in the Human Resources department was 35 (in Q4), and the lowest was 20 (in Q1) so diff is=35-20=15
15. A shopkeeper bought a shirt for Rs. 500 and sold it at a profit of 20%. What is the selling price of the shirt?
a) Rs. 550
b) Rs. 600
c) Rs. 650
d) Rs. 700
Answer: b) Rs. 600
Solution: Let the cost price (CP) be Rs. 500 and the profit be 20%. Profit = 20% of CP = 0.2 × 500 = Rs. 100 Selling Price (SP) = CP + Profit = 500 + 100 = Rs. 600
16. What is the average temperature for the months of July, August, and September?
A) 32.67°C
B) 32.33°C
C) 32.00°C
D) 31.67°C
Answer: A) 32.67°C
Solution: Average temperature = (100 + 110 + 90) / 3 = 300 / 3 = 100°C / 3 ≈ 32.67°C
17. In which month does the rainfall increase the most compared to the previous month?
A) April
B) May
C) June
D) July
Answer: C) June
Solution: Increase in rainfall in June compared to May = 90 mm – 80 mm = 10 mm
18. What is the total rainfall for the months of March, April, and May?
A) 210 mm
B) 2100 mm
C) 2100 cm
D) 210 cm
Answer: A) 210 mm
Solution: Total rainfall = 60 mm + 70 mm + 80 mm = 210 mm
19. During which month does the temperature show the steepest increase compared to the previous month?
A) April
B) May
C) June
D) July
Answer: B) May
Solution: Increase in temperature in May compared to April = 30°C – 25°C = 5°C
20. What is the average rainfall for the first six months (January to June)?
A) 67.5 mm
B) 70 mm
C) 72.5 mm
D) 75 mm
Answer: C) 72.5 mm
Solution: Average rainfall = (50 mm + 45 mm + 60 mm + 70 mm + 80 mm + 90 mm) / 6 = 395 mm / 6 ≈ 72.5 mm
No 21-25: here’s the table representing the expenditures of the company over the given years:
| Year | Salary | Fuel and Transport | Bonus | Interest on Loans | Taxes |
|---|---|---|---|---|---|
| 2000 | 288 | 98 | 3.00 | 23.4 | 83 |
| 2001 | 342 | 112 | 2.52 | 32.5 | 108 |
| 2002 | 324 | 101 | 3.84 | 41.6 | 74 |
| 2003 | 336 | 133 | 3.68 | 36.4 | 88 |
| 2004 | 420 | 142 | 3.96 | 49.4 | 98 |
21. In which year did the company spend the most on salaries?
A) 2000
B) 2001
C) 2002
D) 2003
Answer: D) 2003
Solution: The company spent 336 lakh rupees on salaries in 2003, which is the highest among all the given years.
22. Which item of expenditure had the highest average over the given years?
A) Salary
B) Fuel and Transport
C) Bonus
D) Interest on Loans
Answer: A) Salary
Solution: To find the average, sum up the expenditures for each item and divide by the number of years. Average salary = (288 + 342 + 324 + 336 + 420) / 5 = 1710 / 5 = 342 lakh rupees.
23. In which year did the company spend the least on taxes?
A) 2000
B) 2001
C) 2002
D) 2003
Answer: C) 2002
Solution: The company spent 74 lakh rupees on taxes in 2002, which is the least among all the given years.
24. Which item of expenditure showed the highest percentage increase from 2000 to 2004?
A) Salary
B) Fuel and Transport
C) Bonus
D) Interest on Loans
Answer: A) Salary
Solution: Percentage increase for Salary = [(420 – 288) / 288] * 100% ≈ 45.83%
25. What was the total expenditure of the company in the year 2004?
A) 1050 lakh rupees
B) 1124 lakh rupees
C) 1206 lakh rupees
D) 1222 lakh rupees
Answer: B) 1124 lakh rupees
Solution: Total expenditure in 2004 = 420 + 142 + 3.96 + 49.4 + 98 = 1124 lakh rupees.
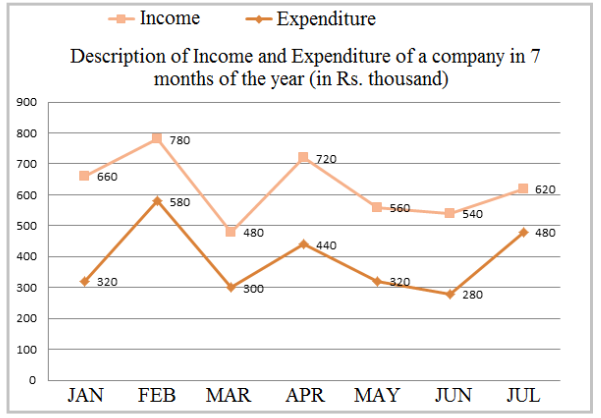
26. What is the average expenditure of the company in the given months (in thousands)?
A) Rs. 389
B) Rs. 350
C) Rs. 420
D) Rs. 310
Answer:A) Rs. 389
Solution:
Average expenditure of the company = Total expenditure / Number of months
Average expenditure = (2720 / 7) = Rs. 389 thousands
Therefore, the correct answer is A) Rs. 389.
27. What is the respective ratio between the percentage profits earned by the company in the months of February and May?
A) 21 : 48
B) 25 : 44
C) 23 : 42
D) 23 : 50
Answer:D) 23 : 50
Solution:
.Profit percent of company = February = [(780 – 580)/580]*100 = 34.5
May = [(560-320)/320]*100 = 75 = 345 : 750 = 23 : 50
28. What is the difference between the total profit earned by the company in the months of February, April, and July and that earned in the months of January, March, and June?
A) Rs. 150
B) Rs. 210
C) Rs. 200
D) Rs. 160
Answer D) Rs. 160
Solution:
Total profit in Feb, Apr, Jul =
200+280+140=Rs.620 thousands
Total profit in Jan, Mar, Jun = 780
340+180+260=Rs.780 thousands
Difference = 780−620=Rs.160 thousands
Hence, the correct answer is D) Rs. 160.
29. By what percent is the profit earned by the company in the month of February less than that earned in the month of January?
A) 45%
B) 52%
C) 47%
D) 41%
E) 50%
Answer : D) 41%.
Solution:
Profit in February = Rs. 780 – Rs. 580 = Rs. 200 thousand
Profit in January = Rs. 660 – Rs. 320 = Rs. 340 thousand
Required % = ((340−200)/340)×100=41.
Therefore, the correct answer is D) 41%.
30.In how many months was the income of the company more than the average income during the given months?
A) 2
B) 1
C) 3
D) 4
Answer : C) 3
Solution:
Average income of the company = 4360/7=Rs.623 thousand
Months with income more than average: January, February, April.
Hence, the correct answer is C) 3.