
Table of Contents
Marks vs Percentile JEE Mains Shift-wise is available here. The NTA issued the JEE Main results for 2025 at jeemain.nta.nic.in, which included candidates’ marks and percentiles. The JEE Main marks describe the candidate’s achievement at the individual level, whereas the JEE Mains percentile represents the candidate’s relative performance.
The Marks vs percentile JEE Mains 2025 shift wise analysis is useful in the admissions process. In this article, we have given students with a comparison study of the JEE mains marks vs percentile shift by shift analysis for the year 2025. Along with this, students may view the JEE Mains percentile vs rank data here.
JEE Mains 2025 Marks vs Percentile
Students frequently have uncertainties regarding marks compared to the percentile in JEE Mains. Here is a comprehensive breakdown of Marks vs percentile JEE Mains 2025 shift wise offered to candidates to assist them in estimating their likely marks effortlessly. Here, candidates are also given JEE Main marks, percentiles, and ranks to aid in understanding their exam ranking.
It is important to mention that the relationship between JEE mains marks vs percentile, and rank is solely for estimating the potential rank in the exam. The NTA releases a combined JEE Main marks vs percentile data for both January and April sessions after the session 2 exam ends.
JEE Mains marks vs percentile vs Rank
The JEE Mains marks vs percentile vs rank data for the 2025 exam has been shared below based on analysis by top experts.
|
Marks Out of 300
|
Percentile (JEE Main 99 percentile marks 2025)
|
Overall Rank
|
|
290- 280
|
99.99908943 – 99.99745041
|
15 – 36
|
|
280 – 250
|
99.99745041 – 99.96976913
|
36 – 428
|
|
250 – 240
|
99.96976913 – 99.94664069
|
428 – 755
|
|
240 – 230
|
99.94664069 – 99.91595453
|
755 – 1189
|
|
230 – 220
|
99.91595453 – 99.86623749
|
1189 – 1893
|
|
220 – 210
|
99.86623749 – 99.80777899
|
1893 – 2720
|
|
210 – 200
|
99.80777899 – 99.73129123
|
2720 – 3803
|
|
200 – 190
|
99.73129123 – 99.62402626
|
3803 – 5320
|
|
190 – 180
|
99.62402626 – 99.48033855
|
5320 – 7354
|
|
180 – 170
|
99.48033855 – 99.2955842
|
7354 – 9968
|
|
170 – 160
|
99.2955842 – 99.06985426
|
9968 – 13163
|
|
160 – 150
|
99.06985426 – 98.77819917
|
13163 – 17290
|
|
150 – 140
|
98.77819917 – 98.40768884
|
17290 – 22533
|
|
140 – 130
|
98.40768884 – 97.94047614
|
22533 – 29145
|
|
130 – 120
|
97.94047614 – 97.35425213
|
29145 – 37440
|
|
120 – 110
|
97.35425213 – 96.60949814
|
37440 – 47979
|
|
110 – 100
|
96.60949814 – 95.64338495
|
47979 – 61651
|
|
100 – 90
|
95.64338495 – 94.39636137
|
61651 – 79298
|
|
90 – 80
|
94.39636137 – 92.76234617
|
79298 – 102421
|
|
80 – 70
|
92.76234617 – 90.4109851
|
102421 – 135695
|
|
70 – 60
|
90.4109851 – 87.06073037
|
135695 – 183105
|
|
60 – 50
|
87.06073037 – 81.57582987
|
183105 – 260722
|
|
50 – 40
|
81.57582987 – 73.08140938
|
260722 – 380928
|
|
40 – 30
|
73.08140938 – 59.84001311
|
380928 – 568308
|
|
30 – 20
|
59.84001311 – 40.3469266
|
568308 – 844157
|
|
20 – 10
|
40.3469266 – 20.95045141
|
844157 – 1118638
|
|
10 – 0
|
20.95045141 – 6.599800585
|
1118638 – 1321716
|
JEE Main 2025 Marks vs Percentile
The JEE Main 2025 results have been published by the National Testing Agency (NTA) in the form of percentile scores. The JEE Main percentile scores represent normalized marks of candidates rather than their actual scores.
Normalization eliminates any potential discrepancies in the difficulty level of the JEE Main 2025 question paper since the exam is conducted over multiple shifts and days. Additionally, the comparison of JEE Main 2025 marks vs percentile is available on this page.
Marks vs Percentile JEE Mains 2025 Shift wise
NTA has clearly outlined the normalization procedure for determining the JEE Main percentile score. The raw scores achieved in JEE Main 2025 by each candidate are transformed into a percentile score to generate the results. The real percentile and rank will be included in the JEE Main 2025 results.
The anticipated marks compared to the percentile for JEE Mains 2025 can be found here. Candidates may consult the table below for JEE mains marks vs percentile to understand their estimated percentile range in the JEE Main outcome.
| JEE Mains 2025 Marks | JEE Mains 2025 Percentile |
| 300-281 | 100 – 99.99989145 |
| 271 – 280 | 99.994681 – 99.997394 |
| 263 – 270 | 99.990990 – 99.994029 |
| 250 – 262 | 99.977205 – 99.988819 |
| 241 – 250 | 99.960163 – 99.975034 |
| 231 – 240 | 99.934980 – 99.956364 |
| 221 – 230 | 99.901113 – 99.928901 |
| 211 – 220 | 99.851616 – 99.893732 |
| 201 – 210 | 99.795063 – 99.845212 |
| 191 – 200 | 99.710831 – 99.782472 |
| 181 – 190 | 99.597399 – 99.688579 |
| 171 – 180 | 99.456939 – 99.573193 |
| 161 – 170 | 99.272084 – 99.431214 |
| 151 – 160 | 99.028614 – 99.239737 |
| 141 – 150 | 98.732389 – 98.990296 |
| 131 – 140 | 98.317414 – 98.666935 |
| 121 – 130 | 97.811260 – 98.254132 |
| 111 – 120 | 97.142937 – 97.685672 |
| 101 – 110 | 96.204550 – 96.978272 |
| 91 – 100 | 94.998594 – 96.064850 |
| 81 – 90 | 93.471231 – 94.749479 |
| 71 – 80 | 91.072128 – 93.152971 |
| 61 – 70 | 87.512225 – 90.702200 |
| 51 – 60 | 82.016062 – 86.907944 |
| 41 – 50 | 73.287808 – 80.982153 |
| 31 – 40 | 58.151490 – 71.302052 |
| 21 – 30 | 37.694529 – 56.569310 |
| 20 – 11 | 13.495849 – 33.229128 |
| 0 – 10 | 0.8435177 – 9.6954066 |
JEE Mains Marks vs Percentile 2025 Shift wise for Physics
Check out the JEE mains marks vs percentile 2025 shift wise comparison for physics subject below –
|
JEE 2025 Marks vs Percentile Physics
|
|
|
JEE Main Physics Percentile 2025
|
Expected Physics Marks
|
|
99.5+ percentile
|
87+ marks
|
|
99+ percentile
|
82 to 87 marks
|
|
98+ percentile
|
76 to 82 marks
|
|
97+ percentile
|
71 to 76 marks
|
|
96+ percentile
|
67 to 71 marks
|
|
95+ percentile
|
64 to 67 marks
|
|
94+ percentile
|
60 to 64 marks
|
|
93+ percentile
|
93+ percentile
|
|
92+ percentile
|
55 to 57 marks
|
|
91+ percentile
|
52 to 55 marks
|
|
90+ percentile
|
49 to 52 marks
|
|
80+ percentile
|
42 to 49 marks
|
|
70+ percentile
|
35 to 42 marks
|
|
60+ percentile
|
30 to 35 marks
|
Percentile vs Marks for Chemistry
Here you can also check the percentile vs marks for the chemistry section –
|
Marks vs Percentile JEE Mains 2025 (Chemistry)
|
|
|
JEE Main Chemistry Percentile 2025
|
Expected Chemistry Marks
|
|
99.5+ percentile
|
71+ marks
|
|
99+ percentile
|
65 to 71 marks
|
|
98+ percentile
|
58 to 65 marks
|
|
97+ percentile
|
54 to 58 marks
|
|
96+ percentile
|
50 to 54 marks
|
|
95+ percentile
|
47 to 50 marks
|
|
94+ percentile
|
44 to 47 marks
|
|
93+ percentile
|
42 to 44 marks
|
|
92+ percentile
|
40 to 42 marks
|
|
91+ percentile
|
38 to 40 marks
|
|
90+ percentile
|
36 to 38 marks
|
|
80+ percentile
|
30 to 36 marks
|
|
70+ percentile
|
25 to 30 marks
|
|
60+ percentile
|
17 to 25 marks
|
JEE Marks vs Percentile 2025 for Maths
Get the idea of the expected maths marks for the JEE 2025 exam.
| JEE marks vs percentile (Maths) | |
|
JEE Main Mathematics Percentile 2025
|
Expected Mathematics Marks
|
|
99.5+ percentile
|
60+ marks
|
|
99+ percentile
|
50 to 60 marks
|
|
98+ percentile
|
41 to 50 marks
|
|
97+ percentile
|
35 to 41 marks
|
|
96+ percentile
|
32 to 35 marks
|
|
95+ percentile
|
28 to 32 marks
|
|
94+ percentile
|
26 to 28 marks
|
|
93+ percentile
|
25 to 26 marks
|
|
92+ percentile
|
23 to 25 marks
|
|
91+ percentile
|
21 to 23 marks
|
|
90+ percentile
|
20 to 21 marks
|
|
80+ percentile
|
16 to 20 marks
|
|
70+ percentile
|
11 to 16 marks
|
|
60+ percentile
|
8 to 11 marks
|
Percentile vs Rank for NTA JEE 2025
The publication of percentile vs rank data is influenced by several factors, including the quantity of registered candidates, the number of exam questions, the exam’s difficulty level, and patterns from marks and ranks in past years’ JEE Main.
Here are the percentile and rank statistics for JEE Main 2025. Applicants can review percentile versus rank information here. Applicants can consult the table provided below for this information:
| Percentile vs Rank | |
| JEE Main Percentile 2025 | JEE Main 2025 Rank |
| 100 – 99.99989145 | 1 – 20 |
| 99.994681 – 99.997394 | 80 – 24 |
| 99.990990 – 99.994029 | 83 – 55 |
| 99.977205 – 99.988819 | 210 – 85 |
| 99.960163 – 99.975034 | 367 – 215 |
| 99.934980 – 99.956364 | 599 – 375 |
| 99.901113 – 99.928901 | 911 – 610 |
| 99.851616 – 99.893732 | 1367 – 920 |
| 99.795063 – 99.845212 | 1888 – 1375 |
| 99.710831 – 99.782472 | 2664 – 1900 |
| 99.597399 – 99.688579 | 3710 – 2700 |
| 99.456939 – 99.573193 | 5003- 3800 |
| 99.272084 – 99.431214 | 6706 – 5100 |
| 99.028614 – 99.239737 | 8949 – 6800 |
| 98.732389 – 98.990296 | 11678 – 9000 |
| 98.317414 – 98.666935 | 15501 – 11800 |
| 97.811260 – 98.254132 | 20164 – 15700 |
| 97.142937 – 97.685672 | 26321 – 20500 |
| 96.204550 – 96.978272 | 34966 – 26500 |
| 94.998594 – 96.064850 | 46076 – 35000 |
| 93.471231 – 94.749479 | 60147 – 46500 |
| 91.072128 – 93.152971 | 82249 – 61000 |
| 87.512225 – 90.702200 | 115045 – 83000 |
| 82.016062 – 86.907944 | 165679 – 117000 |
| 73.287808 – 80.982153 | 246089 – 166000 |
| 58.151490 – 71.302052 | 385534 – 264383 |
JEE Mains Marks vs Percentile Shift-wise Previous Year
As we know that the NTA JEE Mains exam is held in two shifts over multiple days, the marks vs percentile rank of different dates vary from each other. The shift-wise JEE Main marks vs rank data from the previous year JEE Main session 1 exam is shared below for the convenience of students.
|
JEE Main Percentile |
27 Jan Shift 1 |
27 Jan Shift 2 |
29 Jan Shift 1 |
29 Jan Shift 2 |
30 Jan Shift 1 |
30 Jan Shift 2 |
31 Jan Shift 1 |
31 Jan Shift 2 |
1 Feb Shift 1 |
1 Feb Shift 2 |
|
99.50+ |
200 |
190 |
193 |
200 |
198 |
185 |
184 |
187 |
196 |
189 |
|
99.00 – 99.49 |
190 |
175 |
177 |
185 |
183 |
168 |
165 |
170 |
180 |
173 |
|
98.00 – 98.99 |
172 |
154 |
158 |
165 |
162 |
149 |
145 |
150 |
160 |
153 |
|
97.00 – 97.99 |
155 |
138 |
142 |
148 |
145 |
132 |
128 |
133 |
144 |
136 |
|
96.00 – 96.99 |
142 |
125 |
128 |
133 |
131 |
118 |
115 |
120 |
130 |
121 |
|
95.00 – 95.99 |
132 |
114 |
117 |
120 |
119 |
107 |
103 |
110 |
118 |
111 |
|
94.00 – 94.99 |
124 |
105 |
107 |
110 |
109 |
100 |
95 |
101 |
108 |
102 |
|
93.00 – 93.99 |
115 |
98 |
99 |
102 |
102 |
95 |
91 |
95 |
100 |
97 |
|
92.00 – 92.99 |
108 |
93 |
93 |
96 |
96 |
88 |
86 |
90 |
95 |
92 |
|
91.00 – 91.99 |
103 |
88 |
89 |
92 |
93 |
85 |
82 |
86 |
91 |
89 |
|
90.00 – 90.99 |
99 |
85 |
86 |
90 |
89 |
80 |
77 |
82 |
88 |
85 |
Marks vs Percentile JEE Mains: What is Percentile Score?
The JEE percentile score measures an individual’s performance against all other candidates and is distinct from a percentage score or raw marks. The JEE Main percentile score reflects the percentage of candidates who achieved a score equal to or lower than a specific score in the test.
Understanding how to obtain an estimated rank prior to the official declaration can be advantageous, provided the applicant comprehends the normalization method and tiebreakers that are applied to calculate JEE Main scores and percentiles.
Logic Behind Analyzing the JEE Marks vs Percentile 2025
The JEE Main 2025 examination took place in two sessions in January and April, spanning 5 days with 2 shifts daily. It’s possible that the exam paper on a specific day may be tougher or simpler compared to other days. Normalization is performed to address this potential equality in difficulty level. The normalized scores do not represent the real marks achieved by the candidate but rather a relative score calculated using a unique formula devised by NTA.
The following range of JEE Mains marks compared to percentile is provided based on historical trends and the normalization formula implemented by NTA. The following article will offer essential information to applicants regarding JEE Main scores in relation to percentiles.
What is jeemain.nta.nic.in 2025 Score?
The NTA score in JEE Mains is the combined percentile score for all three subjects. Candidates with inquiries about what NTA score means are advised that the NTA score is equivalent to the overall percentile score. Candidates can refer to the following for the meaning of NTA scores and the qualifying marks for JEE Mains 2025.
Marks vs Percentile – Normalization Formula 2025
Once the raw scores are gathered, the NTA utilizes the normalization formula to calculate the percentile rankings for each subject – Maths, Physics, and Chemistry, in addition to the overall score. The top score in each session will achieve a perfect percentile of 100, which is optimal. The JEE Main merit list has been created using the percentile score.
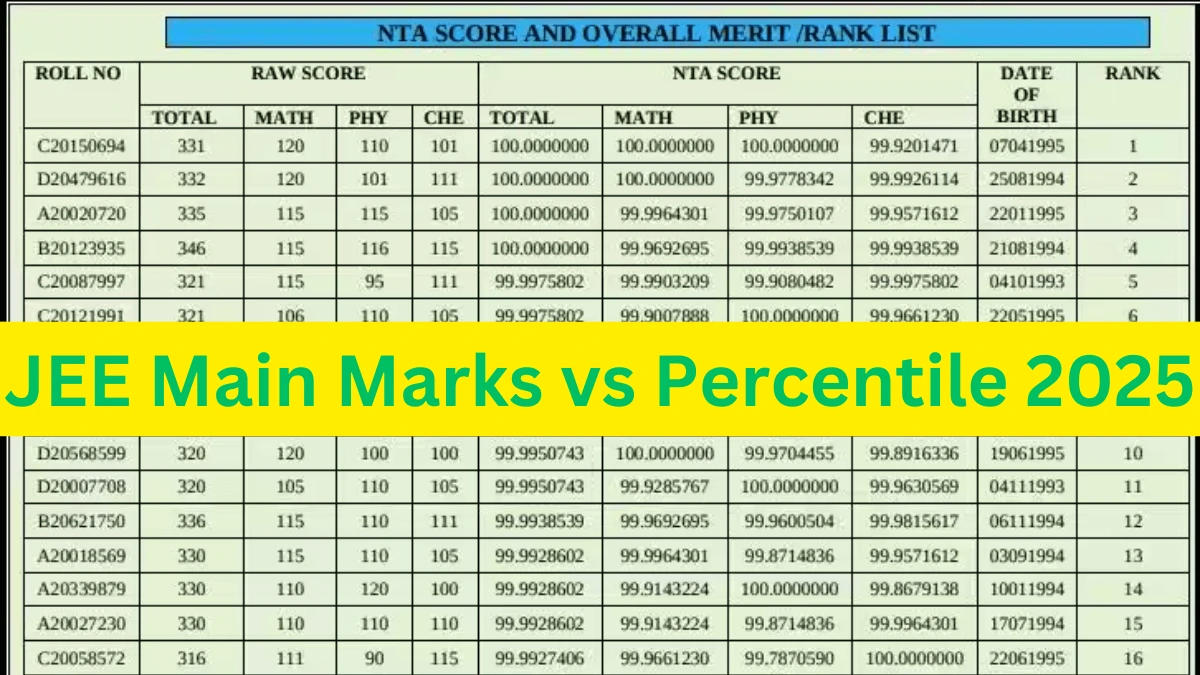
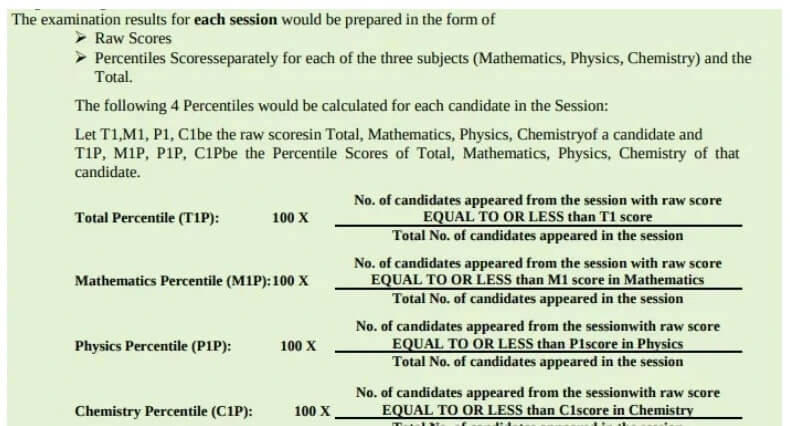
The percentile scores will be computed to 7 decimal places to prevent ties between candidates who have identical scores. A candidate’s JEE Main percentile score is calculated solely after normalizing the marks they have achieved. JEE Main Percentile scores represent the proportion of candidates who achieved a score that is equal to or less than that specific percentile in the test. A percentile score is evaluated based on the following formula:
JEE Main 2025 Marks vs Percentile: Tie Breaking Guidelines
The subsequent rule takes effect when two or more candidates achieve the same percentile scores. In the event of a tie, the inter-se merit will be assessed based on the following rules.
- Candidates achieving a greater Percentile Score in Mathematics will be placed higher in the rankings.
- If a tie remains, the candidate with the superior Percentile Score in Physics will receive a higher ranking.
- If there is still a tie, the candidate with a greater Percentile Score in Chemistry will receive a higher rank.
- If a tie remains, candidates who are older will be prioritized.
The JEE Main result is published independently for every session. The top results from the two sessions are taken into account for candidates who participated in both. The merit list is created based on the final scores, and rankings are declared based on that.

 JoSAA Counselling 2025 To Begin in June,...
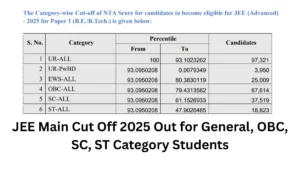 JEE Main Cut Off 2025 Out for General, O...
 JEE Mains Session 2 Result 2025 OUT, Sco...