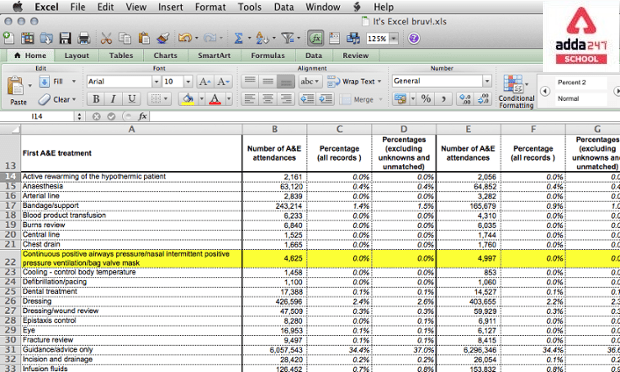
MS Excel
Microsoft Excel is a spreadsheet programme for Windows, macOS, Android, and iOS that was created by Microsoft. Microsoft Excel includes calculating, graphing tools, pivot tables, and Visual Basic for Applications, a macro programming language (VBA).
Microsoft Excel in Hindi
माइक्रोसॉफ्ट एक्सेल विंडोज, मैकओएस, एंड्रॉइड और आईओएस के लिए एक स्प्रेडशीट प्रोग्राम है जिसे माइक्रोसॉफ्ट द्वारा बनाया गया था। माइक्रोसॉफ्ट एक्सेल में गणना, रेखांकन उपकरण, पिवट टेबल और अनुप्रयोगों के लिए विजुअल बेसिक, एक मैक्रो प्रोग्रामिंग भाषा (वीबीए) शामिल है
Microsoft Excel: Functions
Microsoft Excel has become the industry standard for spreadsheets for these systems, notably after version 5 in 1993, when it superseded Lotus 1-2-3 as the industry standard. Microsoft Excel is a programme that is included in the Microsoft Office suite of programmes.
There are 484 functions in Excel 2016, with 360 of the existing previous to Excel 2010. These functions are divided into 14 groups by Microsoft. 386 of the 484 existing functions can be invoked from VBA as methods of the object “WorksheetFunction,” and 44 have names that are the same as VBA functions.
Work in Field of Microsoft Excel Development
Excel has supported end-user macro programming (automation of repetitive activities) and user-defined functions (extensions of Excel’s built-in function library) since its initial release. These programmes were created in a macro language with formula syntax that resided in the cells of special-purpose macro sheets in earlier versions of Excel. Excel’s default macro language until Excel 4.0 was XLM. Excel started recording macros in VBA by default with version 5.0, however, XLM recording was still available as an option. That option was removed in version 5.0. An XLM macro can be run in any version of Excel, including Excel 2010, but Microsoft discourages use.
The essence of Excel remains the same as in the original spreadsheet software, VisiCalc: the application shows cells grouped in rows and columns, each cell may contain data or a formula, and each cell may have relative or absolute references to other cells.
Excel 2.0 for Windows, which was based on its Mac GUI-based cousin, grew the installed base of the then-nascent Windows environment in an indirect way. Excel 2.0 was published a month before Windows 2.0, and Microsoft had to bundle a runtime version of Windows 1.0 with Excel 2.0 due to the tiny installed base of Windows at the time.
Excel was the first spreadsheet to allow users to customise the look of their spreadsheets (fonts, character attributes, and cell appearance). It also introduced intelligent cell re-computation, which updates only cells that are dependent on the modified cell (previous spreadsheet programmes recomputed everything all the time or waited for a specific user command). Excel introduced auto-fill, which allows you to drag and expand the selection box to replicate the contents of a cell or row to adjacent cells or rows, intelligently modifying the copies by incrementing cell references or contents. Excel also came with a lot of graphing features.
Read About Accounting
Microsoft Excel: Functions and Formula
It’s impossible to deny that shortcuts make our life easier. While using Microsoft Excel, you will discover about the wide range of Excel shortcuts available, and it’s always handy to have a list on hand.
Moreover, for beginners to become very proficient in financial analysis, they must first master the basic Excel formulas. Microsoft Excel is widely regarded as the industry standard in data analysis software. In terms of data processing, financial modelling, and presentation, Microsoft’s spreadsheet tool is one of the most popular among investment bankers and financial analysts.
Examples
=SUM(B2:G2) – This sums the values of a row B2 and G2.
=SUM(A2:A8) – This sums the values of a column A2 and A8.


 CUET 2026 Free Batches Launched by CUET ...
 CBSE Date Sheet 2026 for Class 10 & ...
 CBSE Class 10 Date Sheet 2026, Check 10t...


