
It is often seen that concepts that cannot be understood with statements and letters can be better understood with the help of visuals and charts. It is because, they present complex concepts in simple figures, making it easier for everyone to understand. One such concepts of representing processes in technical world, especially computer science, is flowchart. In this article, we will learn about the flow chart in detail by going through its various aspects.
Flowchart
Simply said, flowcharts are a graphical depiction of an algorithm or data that help with visual comprehension of the code. It presents methodical fixes for a problem, algorithm, or procedure. In order to better comprehend computer science algorithms, most novice programmers prefer to use visual representations of the stages, which helps with algorithm troubleshooting. The flow chart is also known as process flow chart or process flow diagram.
What is a Flowchart?
A flowchart is a visual representation of a series of steps in a workflow or process. A flow chart is also known as a visual representation of a process, showing a systematic method for completing a task. A flow chart is a visual representation that shows the steps of a process, system, or computer algorithm. They are commonly utilized across various industries to record, analyze, strategize, enhance, and convey intricate processes in simple, comprehensible diagrams.

What is Flowchart in Computer?
A sequence of boxes representing the steps in a process is called a flowchart in the world of computers. A flowchart makes it simple to analyze and comprehend a process or algorithm since it is a visual representation of the information. In order to create a flow chart, there are a few guidelines that must be adhered to. These guidelines are commonly recognized worldwide and are followed by specialists in the field of computer science.
Flowchart Symbols
Flowcharts, also spelled as flow charts, utilize rectangles, ovals, diamonds and potentially various other shapes to specify the kind of step, as well as connecting arrows to indicate flow and sequence. They can vary from basic, manually drawn charts to detailed computer-generated diagrams showing numerous steps and paths.
When looking at the different types of flow charts, they are among the most popular diagrams worldwide, utilized by individuals in a wide range of fields, both technical and non-technical. Check the commonly used symbols in a flow chart hereunder.
| Name of the Symbol | Diagrammatic Representation of the Symbol |
|---|---|
| Terminal/Terminator |  |
| Process |  |
| Decision |  |
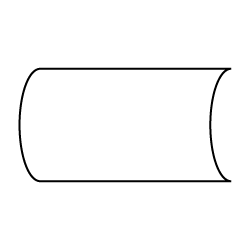
| Document |
|
| Data or Input / Output |  |
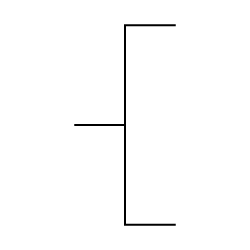
| Stored Data |
|
| Flow Arrow |  |
| Comment or Annotation |
|
| Predefined process |
|
| On-page connector/reference |  |
| Off-page connector/reference |
 |


When to Use a Flowchart?
We should use the process flow diagram in the following scenarios:
- In order to gain insight into the execution of a procedure
- To research a procedure to make it better.
- To convey the steps of a procedure to others
- When there is a need for improved communication among individuals working on the same task.
- To record a procedure
- When strategizing for a project
Types of Flow Charts
Various types of flowcharts are described by different authors using different terminology. This group consists of well-known professionals like Alan B. Sterneckert, Andrew Veronis, Marilyn Bohl, and Mark A. Fryman. In his 2003 book Critical Incident Management, Sterneckert identified four common flow chart types that focus on flow controls rather than the actual flow. check the four common types of flow charts below.
- Process Flow Chart: This particular flow chart illustrates every step included in the production of a product. It offers a way to examine the product that will be constructed. A process flowchart is frequently utilized in process engineering to demonstrate the connection between the primary and secondary components found in the product. It is utilized in business product modeling to aid employees in comprehending project requirements and obtaining insight into the project.
- Document Flow Chart: They are meant to illustrate the controls in place for document flow within a system. The flow chart is read from left to right, documenting how documents move through different business units.
- Data Flow Chart: Data flowchart is utilized for examining data, particularly in analyzing structural project details, as implied by its name. With this flow chart, it is simple to comprehend the flow of data entering and exiting the system. Most often utilized for data management or analyzing information moving back and forth within the system.
- Business Process Modeling Diagram: By utilizing this flow chart or diagram, individuals can systematically illustrate the business process and facilitate the comprehension of business activities and information flow. This diagram shows the business process and models visually, facilitating improvements in the process.
Basic Procedure to Make a Flow Chart
All the flowcharts, whether technical and non technical, are made using the basic procedure given below.
- Describe the process that will be illustrated in a diagram. Title: Paraphrasing Text
- Paraphrase the text using the same input language and maintaining the same word count.
- Engage in a conversation to determine the limits of your process: When and where does it begin? When or where does it come to a conclusion? Have a conversation and make a determination about how detailed the diagram should be.
- Generate ideas for the activities happening. Record each one on a card or post-it note.
- Put the activities in the correct order.
- Once all tasks are accounted for and there is consensus on the order, indicate the process flow by drawing arrows.
- Consult with other stakeholders in the process (employees, managers, vendors, clients) to verify if they concur with the accuracy of the depicted process in the flowchart.

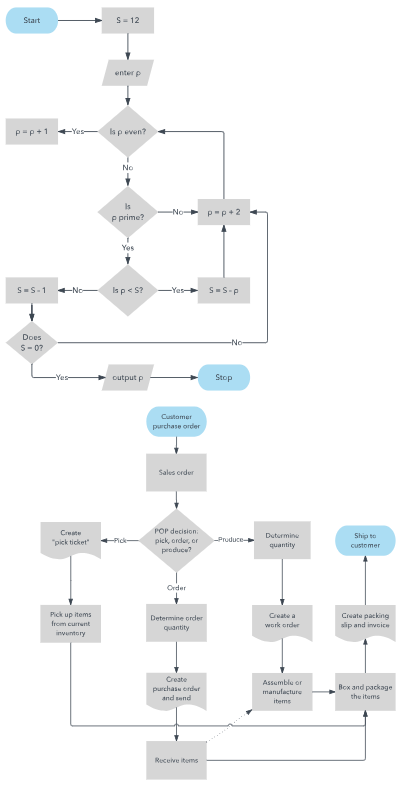
Flowchart Examples
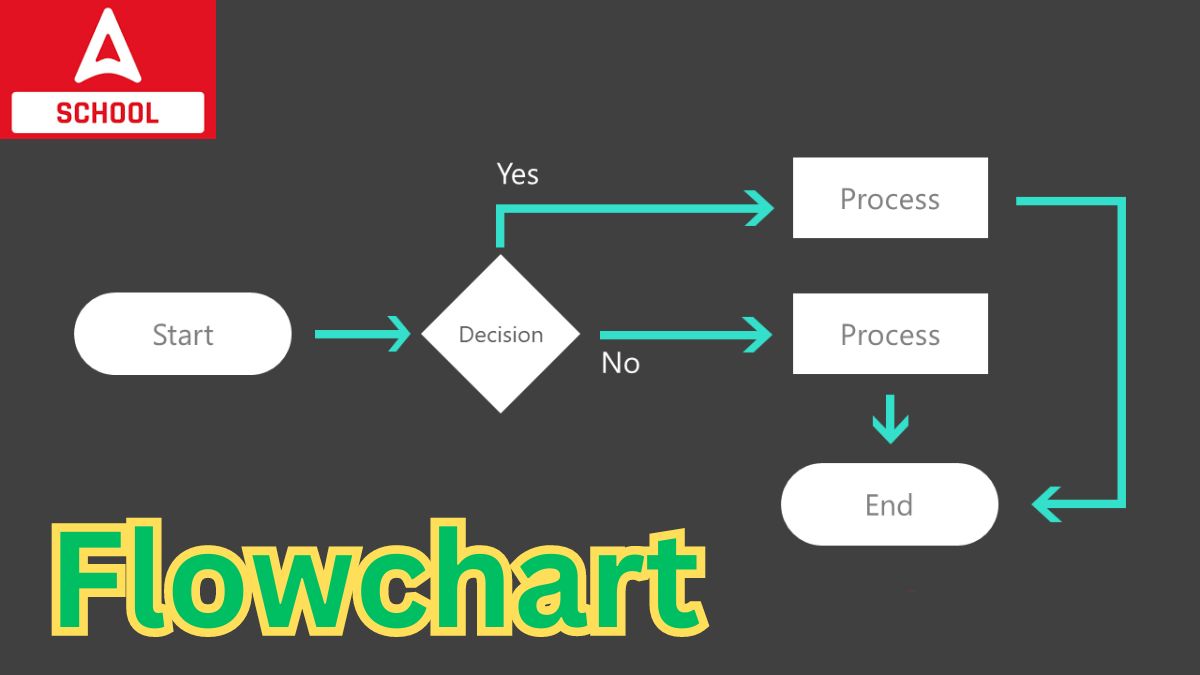
The diagrammatic representation of flow charts have been provided below for a better understanding of the concept.
Basic Flowchart
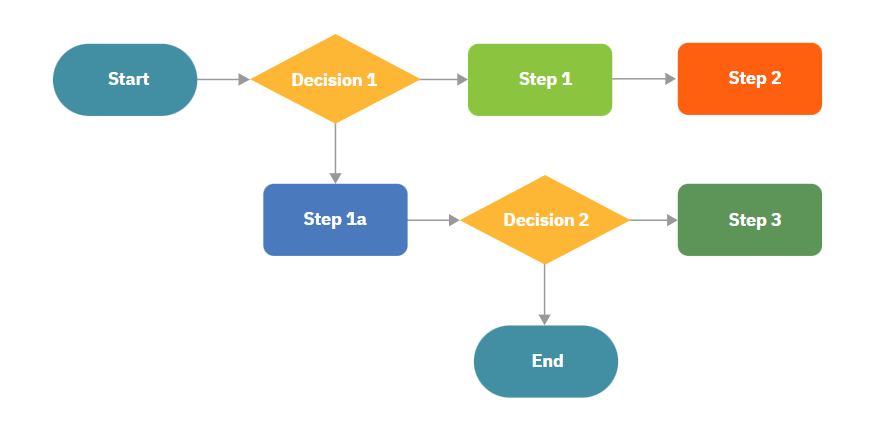
Flow Chart Example 2
Advantages of Flow Charts
The flow charts finds many advantage which has been discussed below.
- It is the most effective method of conveying the system’s logic.
- It serves as a roadmap for creating a plan in the program’s design process.
- It also aids in the process of identifying and resolving errors.
- With the use of flow charts, we can effectively evaluate the programs.
- Flowcharts are effective for the purpose of documenting.
Flowchart Disadvantages
Just like any other method or concept, there are disadvantages of using flow charts also. The disadvantages of using process flow diagrams have been discussed hereunder.
- Creating flow charts for extensive and intricate programs can be quite difficult.
- It lacks the appropriate level of information.
- It is not easy to replicate flow charts.
- It is very challenging to make changes to flow charts.


 All Input and Output Devices of Computer
 BTech Computer Science Syllabus 2025 Out...
 Data Science Course Syllabus 2025, Check...