

Table of Contents
Data distribution plays a pivotal role in the field of statistics, with two primary categories: population distribution, which characterizes how elements are spread within an entire population, and sampling distribution, which reflects the distribution of elements within samples drawn from that population. In this article, we will understand the realm of sampling distributions, exploring their meaning, characteristics, and various types.
Meaning of Sampling Distribution
A sampling distribution provides insight into the expected behavior of numerous simple random samples drawn from the same population. This forms the theoretical foundation of statistical inference and contributes to informed decision-making. Essentially, a sampling distribution is a theoretical probability distribution of a statistic, derived through the analysis of a large number of samples drawn from a specific population.
It is visually represented through graphs depicting statistics derived from sample data. As per Walsh’s perspective, a sampling distribution is a crucial construct comprising an infinite number of sample means of equal size drawn from the population.
Characteristics of Probability Distribution
The key attributes of a probability distribution encompass:
- Universality of Probability Distribution: Probability distributions typically exhibit a universal quality, transcending specific populations or datasets.
- Randomness of Sample Statistics: In every probability distribution, sample statistics manifest as random variables, introducing an element of unpredictability.
- Approximation to Normal Distribution: Probability distributions often closely approximate the shape of a normal distribution, resembling the familiar bell curve.
- Form of Distribution Representation: The form of a distribution is denoted by the shape of the curve that describes it, encapsulating the unique characteristics of the distribution.
Importance of Sampling Distribution
Sampling distributions hold significant importance across various facets of statistical analysis.
- They facilitate the exploration of statistical properties, guide the selection of distribution types for modelling, and play a crucial role in hypothesis testing.
- For instance, a statistic is considered unbiased when its expected value aligns with that of the corresponding population parameter.
Properties of Statistics
Statistics exhibit diverse properties as estimators of population parameters.
- The sampling distribution of a statistic offers insights into several critical properties.
- For example, if the expected value of a statistic mirrors that of the corresponding population parameter, the statistic is deemed unbiased.
Selection of Distribution Type to Model Scores
The sampling distribution provides the theoretical underpinning for selecting appropriate distribution types for a variety of measures. Notably, the central limit theorem elucidates why measures that aggregate independent quantities, such as intelligence scores, tend to follow a normal (Gaussian) curve.
Hypothesis Testing
The sampling distribution plays an integral role in the hypothesis-testing process. It is employed in hypothesis testing to construct a model that depicts the hypothetical scenario where the null hypothesis holds true, and a statistic is collected an infinite number of times. A single sample is drawn, its statistic is computed, and then compared to the model generated by the sampling distribution of that statistic under the null hypothesis. If the sample statistic appears improbable within the model, the null hypothesis is rejected, and a model with real effects gains credibility.
Types of Sampling Distribution
Sampling distributions play a crucial role in statistics, providing valuable insights into how sample data behaves in relation to the population from which it is drawn.
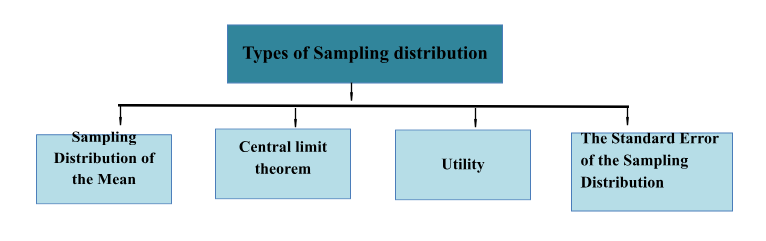
Sampling Distribution of the Mean
The concept of the Sampling Distribution of the Mean holds fundamental significance. It represents the theoretical probability distribution of sample means obtained by extracting all possible samples of the same size from a given population.
It is Calculated as Follows
In the case of a finite population characterized by a mean (m) and variance (s), if we conduct sampling from a population that follows a normal distribution, we can observe the following characteristics in the distribution of the sample mean:
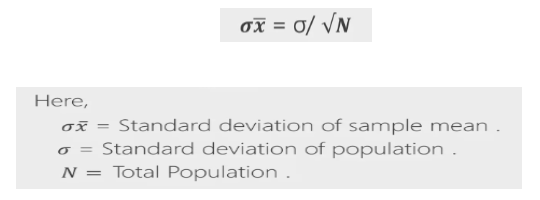
Properties of the Sampling Distribution
- The distribution of the sample means follows a normal distribution.
- The average value of the sample means coincides with the population mean from which the samples were derived.
- The variance of the sample mean distribution is equivalent to the population variance divided by the sample size.
Central Limit Theorem
The Central Limit Theorem stands as a cornerstone in the field of statistics. It asserts that, regardless of the population distribution, the distribution of sample means approaches a normal distribution as the sample size increases. This theorem has wide-ranging implications, as it allows us to make inferences about populations based on the properties of sample means, simplifying many statistical analyses.
Symbolically, the theorem can be explained as follows:
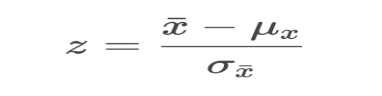
As per the central limit theorem
- Sample mean = population mean
- Sample standard deviation = standard deviation of population/root n
The sampling distribution of the proportion is found when the sample proportion and proportion of successes are given.
Key Properties of the Central Limit Theorem include
- The sample proportion tends to converge towards the true population proportion.
- Under specific conditions, the distribution of the sample proportion can be reasonably approximated by a normal distribution.
Utility
Utility emphasizes the practicality of the central limit theorem. It doesn’t rely on specific assumptions about the distribution of individual random variables, making it a versatile tool for approximating probability values associated with sums of independently distributed random variables. This theorem’s significance lies in its ability to explain the prevalence of normal distribution in various phenomena.
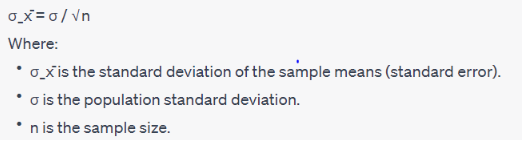
The Standard Error of the Sampling Distribution
The Standard Error of the Sampling Distribution is a measure of the variation of sample means around the population mean. It plays a critical role in quantifying the precision of statistical tests and estimations. By reducing sampling error as the sample size increases, the standard error allows for more accurate assessments of population parameters.
The formula for standard error is based on the population standard deviation and the square root of the sample size which is as follows:
The standard error serves three key purposes:
- Quantifying Test Accuracy: It measures how accurately a test provides scores. Smaller standard errors indicate greater measurement precision.
- Impact on Range: Smaller standard errors result in narrower intervals for the population mean, implying more confidence in the estimate.
- Precision Effect: Conversely, larger standard errors lead to wider intervals for the population mean, indicating lower estimation precision.
Conclusion
In conclusion, the types of sampling distributions discussed here are essential tools in statistics. They provide the means to understand how sample data behaves relative to the population and enable us to make meaningful inferences about populations based on limited sample information.
Download UGC NET Commerce Study Notes PDF
The direct Link to Download UGC NET Commerce Study Notes PDF has been mentioned below. Candidate can download Sampling Distributions Study Notes PDF which has been mentioned below.
Download Sampling Distributions Study Notes PDF


 UGC NET Commerce Syllabus 2026 PDF Downl...
 UGC NET Philosophy Syllabus 2026 PDF Dow...
 UGC NET Teaching Aptitude Questions Answ...