Table of Contents
In the realm of logical reasoning and critical thinking, arguments play a vital role in presenting ideas and persuading others. When evaluating the validity of arguments, it’s essential to consider their structure and supporting evidence. One useful tool for visualising and understanding argument types is the Venn diagram. It is a useful visual tool in data interpretation and analysis, particularly when dealing with sets and their relationships. Candidates preparing for UGC NET Exam 2024 must read the following article for better preparation and understanding.
What is a Venn Diagram?
A Venn diagram is a graphical representation that uses overlapping circles or other shapes to illustrate the relationships and commonalities between different sets of data or groups. Each circle represents a specific set, category, or group, and the overlapping regions show the elements that belong to more than one set. Venn diagrams are commonly used in mathematics, logic, statistics, and various fields of data analysis to visually depict the intersections, unions, differences, and relationships between sets, making complex concepts and data relationships easier to understand.
Defining Simple and Multiple-Use Arguments
Before delving into the visual representation, let’s establish a clear understanding of what simple and multiple-use arguments entail.
Simple-Use Arguments
- A simple-use argument is characterized by its focus on a single point or claim to establish its validity.
- These arguments often rely on clear and straightforward reasoning without the need for extensive supporting evidence.
- Simple use arguments are commonly used in situations where the claim itself is self-evident or widely accepted.
Example: “Exercise is beneficial for overall health.”
In this simple-use argument, the claim is straightforward, and no additional supporting evidence is necessary to establish its validity. The statement itself is widely acknowledged, making it a simple use argument.
Multiple Use Arguments
- Multiple-use arguments employ a series of interconnected points or claims to establish their validity.
- These arguments present a chain of reasoning, where each claim builds upon the previous ones to form a coherent and persuasive argument.
- Multiple-use arguments are often utilized when dealing with complex or controversial topics that require a more comprehensive analysis.
Example: “Increased physical activity leads to improved cardiovascular health, weight management, and reduced risk of chronic diseases.”
This multiple-use argument presents multiple interconnected claims, each contributing to the overall validity of the argument. The combination of these claims strengthens the overall case being made. In this case, the argument establishes a clear cause-and-effect relationship between physical activity and various health benefits, supporting the overall claim being made.
Visualizing Simple and Multiple-Use Arguments
To visually represent the concepts of simple and multiple-use arguments, we can employ the use of Venn diagrams. Venn diagrams are composed of overlapping circles that symbolize different sets or categories. In our case, we’ll utilize the circles to represent the sets of arguments that are simple use and multiple uses, respectively.
Simple Use Arguments
To represent simple use arguments in a Venn diagram, we create a circle labelled “Simple Use.” This circle encompasses the arguments that rely on a single point or claim without the need for extensive supporting evidence.
Multiple Use Arguments
To depict multiple-use arguments, we create another circle labelled “Multiple Use.” This circle represents arguments that rely on a series of interconnected claims to establish their validity.
The overlapping region between these two circles represents arguments that can be both simple use and multiple uses, although such cases are relatively rare. Most arguments tend to fall into either the simple-use or multiple-use category.
10 Conditions to Test the Validity of Arguments
When the items are of different groups, the visual representation looks different for each of teh case. There are 10 conditions to test the validity of argument through the visual representation of venn diagram. In the following section, candidates will find these 10 condition
Condition 1- Different Groups with no Connection
When the items are of different groups, they will be shown as follows:
For Example Author, Lawyer and Singer. These three are completely different professions and hence no connection can be established.

Condition 2- Sequential Relationship Between Items
When the first word is related to the second word, and the second word is related to the third word, they will be shown as follows:
For Example Millimetre, centimetre, Meter
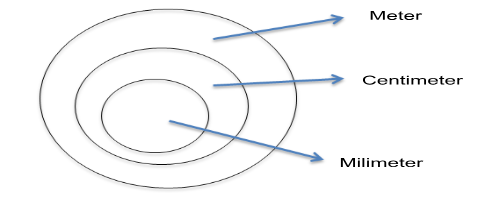
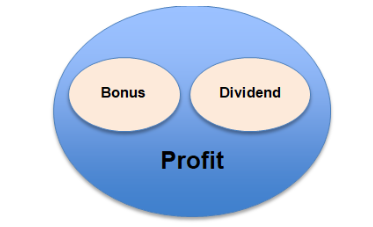
Condition 3- Two Items Entirely Related to the Third
When two items are entirely related to the third item they will be shown as below:
For example Bonus, Dividend, profit. Profit can be given in the form of bonus and dividends.
Condition 4- Relation Between Two Items with Both Related to a Third
When there is a relation between two items but two items are completely related to the third item they will be shown as below:
For example Product, factory and Machinery. Products and machinery can be found in the factory. Moreover, there is a direct relation between Product and Machinery.

Condition 5- Partial Relation Between Two items, which are Different from the Third
When two items are related to the third item to some extent but not entirely, and the first two items are completely different, they will be shown as below:
For example Boys, Students and Girls. Boys and girls are different gender but boys can be students as well as girls can also be students.

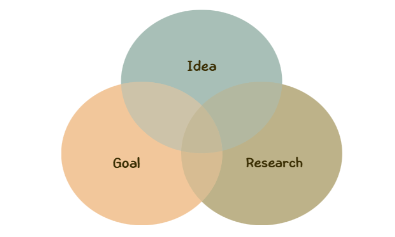
Condition 6- All Three Items Related to Each Other to Some Extent
All three items are related to one another, but to some extent, not completely. They will be shown below:
For Example Goals, Ideas, and Research for creating a business. They are interrelated.
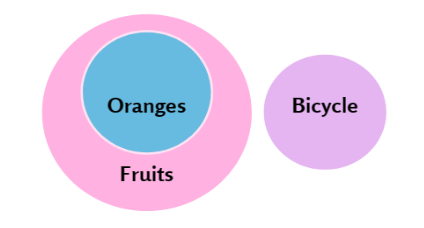
Condition 7- Two Items Completely Related, Third Different
When two items are completely related to each other, and the third item is completely different from the first two. It will be shown as follows;
For example Oranges, Fruits, Bicycle. Oranges are fruit and no bicycle is fruit.
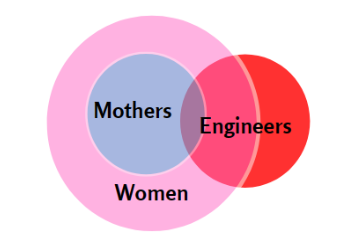
Condition 8- First Item Completely Related to Second, Third Partially Related
When the first item is completely related to the second and the third item is partially related to the first and second items. It will be shown as follows:
For example Women, Mother and Engineers. All mothers belong to women, but some mothers are engineers, but not all.
Condition 9- First Item Partially Related to Second, Third Entirely Different
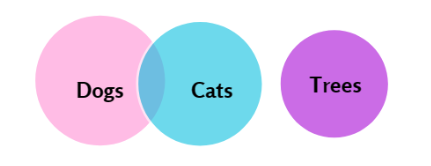
When the first item is partially related to the second, but the third is entirely different from the first two. It will be shown as follows:
For example Dogs, cats, trees. Dogs and cats are animals and cannot be trees.
Condition 10- First & Third Items Partially Related to the Second
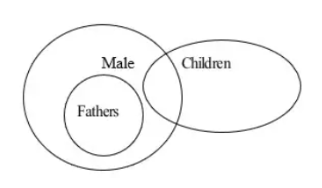
When the first item is partially related to the second and the third item is partially related to the first and second items. It will be shown as follows:
For example, Fathers, Males and Children. All Fathers are Male and Some Children are Male.
Conclusion
Venn diagrams provide a valuable visual tool for understanding and analyzing the structure of arguments. By utilizing this tool, we can categorize arguments into simple use and multiple uses, based on whether they rely on a single claim or a series of interconnected claims to establish their validity. Understanding the distinction between these argument types can enhance our critical thinking skills and enable us to evaluate the strength and effectiveness of different lines of reasoning.
Download Venn Diagram Study Notes PDF



 OTET Answer Key 2025 Out (Unofficial), D...
 CTET Exam Date 2025 Out, Check Eligibili...
 Rajasthan BSTC Pre Deled 2026 Notificati...


