Table of Contents
HCES digs deep into household spending habits, giving us a clear picture of what they buy and how they’re doing. This data, combined with demographics, is vital for understanding living standards. But HCES goes beyond households. It shapes Consumer Price Indices (CPIs) by revealing spending on different goods. This ensures that CPIs accurately reflect real-world purchases. HCES data also helps analyze the overall health of the economy. The pandemic delayed the planned surveys in 2020-21 and 2021-22, but the first one is finally underway (Aug 2022 – July 2023). This information will be crucial for understanding changing spending patterns and their economic impact.
A Legacy of Deep Dives
The Household Consumption Expenditure Survey (HCES) is a cornerstone of data collection by India’s National Sample Survey Office (NSSO). It began modestly, collecting spending info in every NSS round since 1950-51. Recognizing the value of deeper dives, the NSSO shifted to large, in-depth surveys on consumer expenditure every five years, starting with the 27th round (1972-73) and continuing through 2011-12. The “Household Consumption Expenditure Survey 2022-23” is the latest chapter in this legacy.
India’s Spending Habits
This report dives into the latest Household Consumption Expenditure Survey (HCES) conducted in 2022-23. Here’s a breakdown of key findings based on Monthly Per Capita Consumption Expenditure (MPCE):
National Averages
- Rural vs. Urban: The average MPCE stands at ₹3,773 for rural and ₹6,459 for urban households. This translates to a higher share of spending on food items in rural areas (46%) compared to urban areas (39%).
- Income Inequality: The bottom 5% of both rural and urban populations have a significantly lower MPCE (₹1,373 and ₹2,001 respectively) compared to the top 5% (₹10,501 and ₹20,824 respectively).
State-wise Variations
- Highest MPCE: Sikkim leads in both rural (₹7,731) and urban (₹12,105) categories.
- Lowest MPCE: Chhattisgarh has the lowest MPCE for both rural (₹2,466) and urban (₹4,483) areas.
- Rural-Urban Gap: Meghalaya shows the highest disparity (83%) between rural and urban MPCE, followed by Chhattisgarh (82%).
Union Territories
- Highest MPCE: Chandigarh boasts the highest MPCE in both rural (₹7,467) and urban (₹12,575) categories.
- Lowest MPCE: Ladakh (₹4,035) and Lakshadweep (₹5,475) have the lowest MPCE for rural and urban areas respectively.
Including Social Welfare
This section explores the impact of including social welfare programs on the 2022-23 HCES data. Here’s a breakdown of key findings based on Monthly Per Capita Consumption Expenditure (MPCE) with these imputed values:
National Averages
- Slight Increase: Average MPCE rises slightly, reaching ₹3,860 for rural and ₹6,521 for urban households. The spending share on food remains similar (around 47% rural, 40% urban).
- Income Disparity Persistence: The gap between the bottom 5% (₹1,441 rural, ₹2,087 urban) and top 5% (₹10,581 rural, ₹20,846 urban) remains significant.
State-wise Variations
- Similar Leaders and Laggards: Sikkim retains the top spot (rural: ₹7,787, urban: ₹12,125) while Chhattisgarh remains at the bottom (rural: ₹2,575, urban: ₹4,557).
- Persistent Rural-Urban Gap: Meghalaya (83%) and states like Chhattisgarh and Jharkhand (77%) show the highest disparity between rural and urban spending.
Union Territories
- Chandigarh Stays Ahead: Chandigarh holds onto the top spot for both rural (₹7,467) and urban (₹12,577) categories. Ladakh (rural: ₹4,062, urban: ₹5,511) and Lakshadweep remain at the bottom.
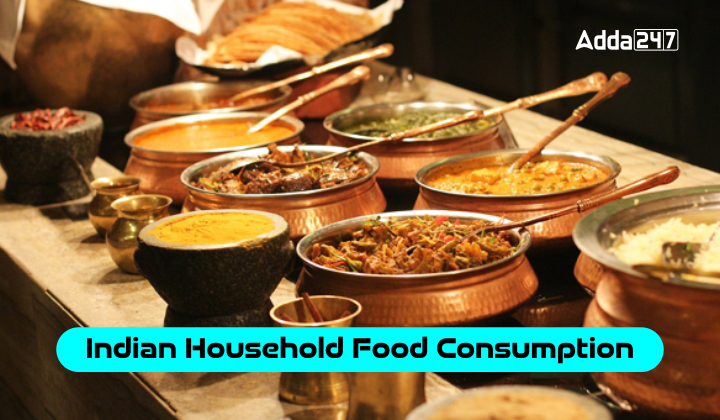
What’s on the Indian Plate?
- Preference Shift: A notable tilt towards beverages, refreshments, and processed foods marks a contemporary change, with similar consumption patterns in both rural and urban settings.
- Nutritional Choices: Milk and dairy products emerge as significant components of dietary expenditure, followed by micronutrient-rich vegetables and protein sources like eggs, fish, and meat.
- Processed Foods: The rising share of processed foods, laden with sugar and salt, raises health concerns, underscoring the need for nutrition literacy and healthier eating practices.
- Pulse Consumption: The decline in pulse consumption points to affordability issues and necessitates measures to boost their availability and consumption.
Intra-Household Food Allocation and Nutrient Intake
- Anaemia and Nutrient Intake- The survey highlights the need to delve deeper into intra-household food distribution, especially given the high anemia rates among women and children.
- Processed Food Intake-The actual intake of salt and sugar through processed foods remains unquantified, posing challenges in addressing obesity, diabetes, and hypertension risks.
Nutrition Surveys and Literacy Initiatives
- Dietary Surveys: The discontinuation of the NNMB and the ongoing nationwide dietary survey by the National Institute of Nutrition underscores the importance of understanding nutrient intake patterns.
- Consumer Education: Initiatives like front-of-pack food labeling and nutrition literacy campaigns are critical to promoting informed food choices.
Policy Recommendations and Healthy Eating Promotion
- HFSS Foods Taxation: Implementing a health tax on high-fat, sugar, and salt foods, as recommended by Niti Aayog and practiced globally, could deter unhealthy eating habits.
- Government-Run Eateries: Promoting healthy alternatives in government eateries could serve as a public health investment, improving overall nutrition.
- Anganwadi and School Meal Schemes: Incorporating more vegetables and diverse foods in government meal programs can instill healthy eating habits from a young age.
- Public Distribution System (PDS): Expanding the PDS basket to include a wider variety of nutritious foods could enhance nutrition security across the population.
Towards a Healthier Future
The HCES 2022-23 data sheds light on evolving dietary habits and opens avenues for policy interventions aimed at promoting balanced nutrition and mitigating health risks associated with processed food consumption. By embracing a multi-faceted approach that includes education, taxation, and government-supported initiatives, India can navigate towards improved dietary diversity and public health outcomes.


 TSPSC Group 1 Question Paper 2024, Downl...
 TSPSC Group 1 Answer key 2024 Out, Downl...
 UPSC Prelims 2024 Question Paper, Downlo...


